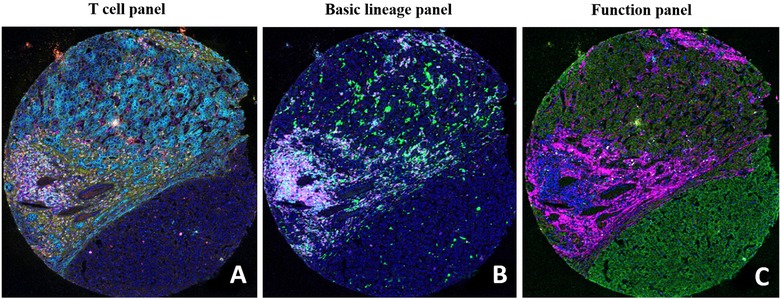
FIGURE 3.

Representative IMC images of human tissue sections. Each image depicts the tumor microenvironment with the following immune cell lineages: T cell panel (A; CD45RO depicted in green, CK in cyan, collagen in yellow, CD8 in red, CD4 in magenta, and Ki67 in white), basic lineage panel (B; CD68 in green, CD20 in cyan, PD‐L1 in yellow, VISTA in red, CD3 in magenta, and CD45 in white), and function panel (C; OX40 in green, CD38 in cyan, Ki67 in yellow, ecadherin in red, collagen in magenta, and granzymeB in white). Abbreviations: IMC, imaging mass cytometry; PD‐L1, programmed cell death ligand 1
