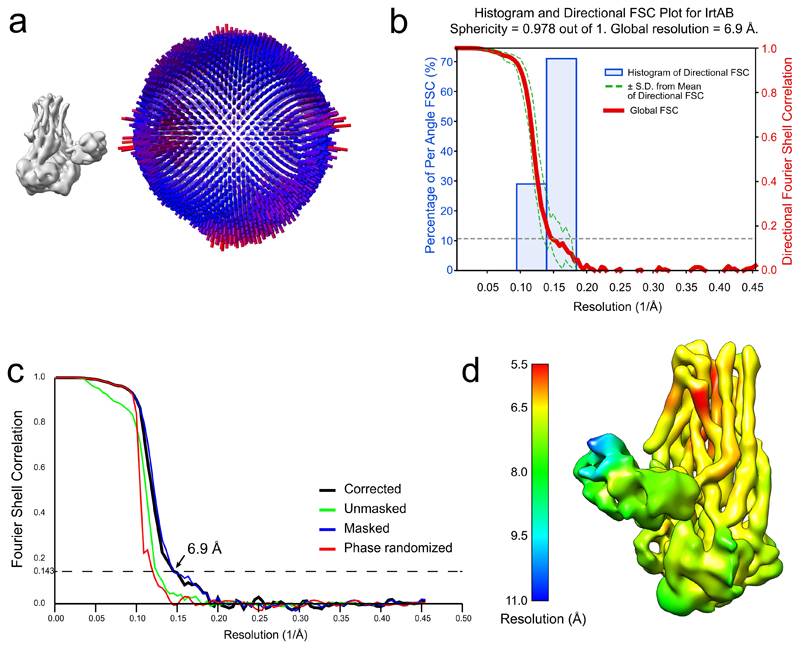
Extended Data Figure 3. Cryo-EM data validation.
a, Angular distribution plot of all IrtAB particles that contributed to the final map. The map and the angular distribution plot have the same orientation. The height and color of the cylinder bars is proportional to the number of particles in those views. b, Plot of the directional Fourier Shell Correlation (FSC) that represents a measure of directional resolution anisotropy. Shown are the global FSC (red line), the spread of directional resolution values defined by ± 1 standard deviation from the mean of the directional resolutions (area encompassed by the green dotted lines) and a histogram of 100 directional resolutions evenly sampled over the 3D FSC (blue bars). A sphericity of 0.978 was determined at an FSC threshold of 0.5, which indicates very isotropic angular distribution (a value of 1 stands for completely isotropic angular distribution). The global resolution was determined to 6.9 Å (0.143 threshold). Directional FSC determination was performed with the 3DFSC software c, Fourier Shell Correlation (FSC) plot of the final density map of IrtAB. The plot shows the unmasked (green), masked (blue), phase randomized (red) and masking-effect corrected (black) FSC curves. The resolution at which the gold-standard FSC curve drops below the 0.143 threshold is indicated. d, Local resolution variations in the cryo-EM map. The resolution ranges from 5.5 to 10.8 Å, as calculated by BlocRes.

