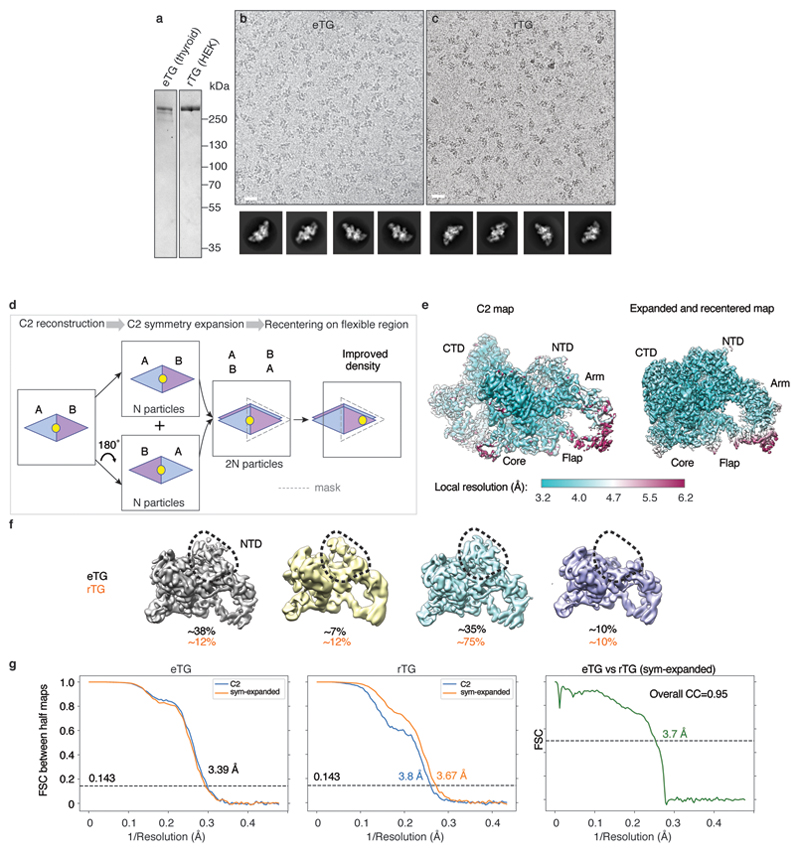
Extended Data Figure 2. Cryo-EM reconstruction of endogenous and recombinant thyroglobulin (eTG, rTG).
a) SDS-PAGE of endogenous eTG from goitrous thyroid extracts and recombinant rTG expressed in HEK293T cells. b) Cryo-EM micrograph of eTG with calculated reference-free 2D class averages below. Scale bar 200 Å. c) Cryo-EM micrograph of recombinant rTG with 2D class averages, showing the two proteins to be structurally identical at this level of analysis. Scale bar 200 Å. d) Schematic illustrating the C2 symmetry-expansion and re-centring procedure, which was used to enhance TG map quality in peripheral regions. For a detailed procedure see the Methods section ‘Cryo-EM image processing’. e) Local resolution of the C2 and symmetry-expanded and re-centred eTG maps. f) Flexibility of N-terminal domain (NTD) resulting in varying map quality and occupancy of this region in a number of 3D class averages (calculated in RELION). g) Fourier shell correlation (FSC) between RELION 'gold standard' half-maps and between the final eTG and rTG maps, showing their strong similarity.

