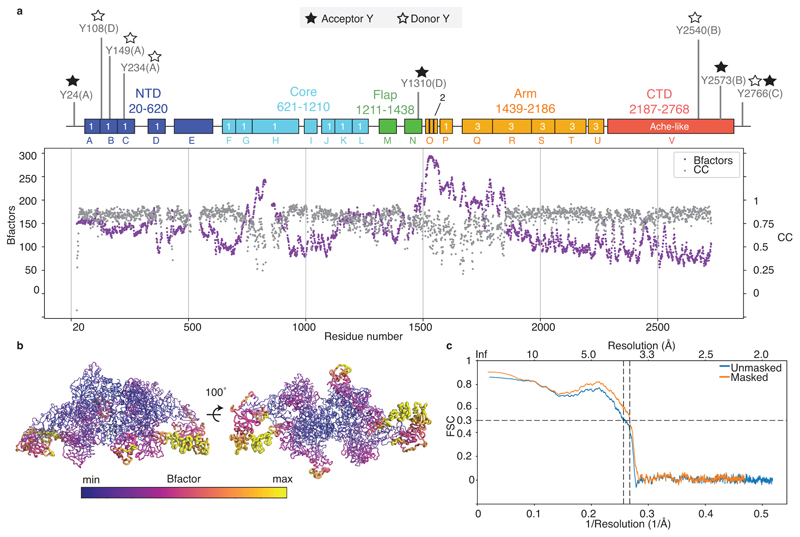
Extended Data Figure 3. Local properties of the atomic TG model.
a) Per-residue atomic B-factor and cross correlation with the rTG map, plotted per residue number. b) Local B-factor colour-coded onto the surface of the TG structure. c) FSC between the map and model calculated for rTG. FSC 0.5 is indicated.

