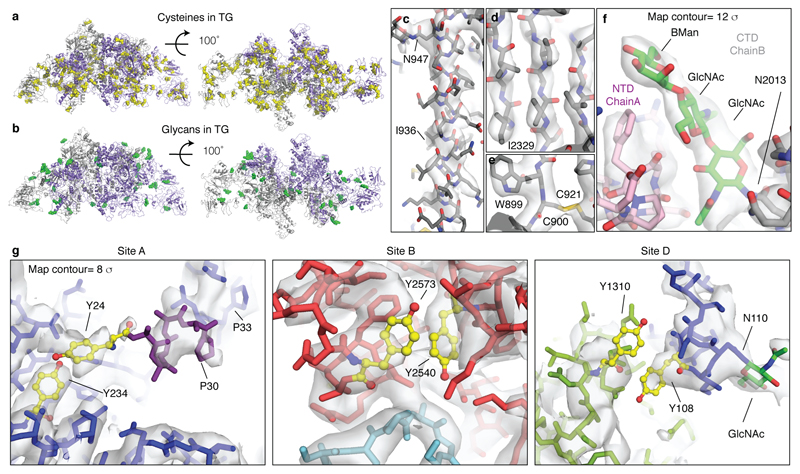
Extended Data Figure 5. TG cryo-EM map details.
a) All disulfide bonds in TG included in the model (yellow spheres). b) Glycans detected in the cryo-EM maps and included in the TG atomic model (green spheres). c) Close-up view of a typical alpha helix in the TG cryo-EM map (part of the Core region). d) Close-up of a beta sheet in TG (part of the ChEL domain). e) Close-up of the disulfide bond C900-C921 (Core region). f) Map details of N2013 and N-linked GlcNAc between two TG subunits. g) Close-up views showing conformational disorder within the hormonogenic sites, making precise side chain placements difficult, but the backbone positions are resolved (rTG map).

