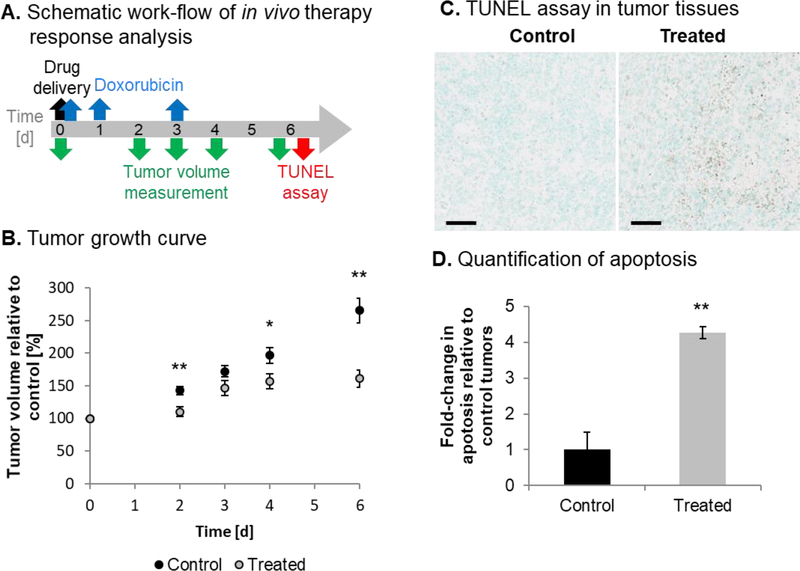
FIG. 4.
Tumor growth and apoptosis in the murine immune-competent Hepa1–6 syngeneic HCC mouse model upon UTMD-mediated miRNA delivery and Dox co-treatment. (A) Schematic illustration of treatment timing of in vivo therapy conditions and assessment. (B) Growth curves of untreated control tumors (N=6) and treated tumors (N=10). (C) Representative TUNEL assay results of tumors from control and treated animals. Scale bars indicate 50 μm. (D) Quantified apoptosis staining in control and treated tumor slices (N=3).

