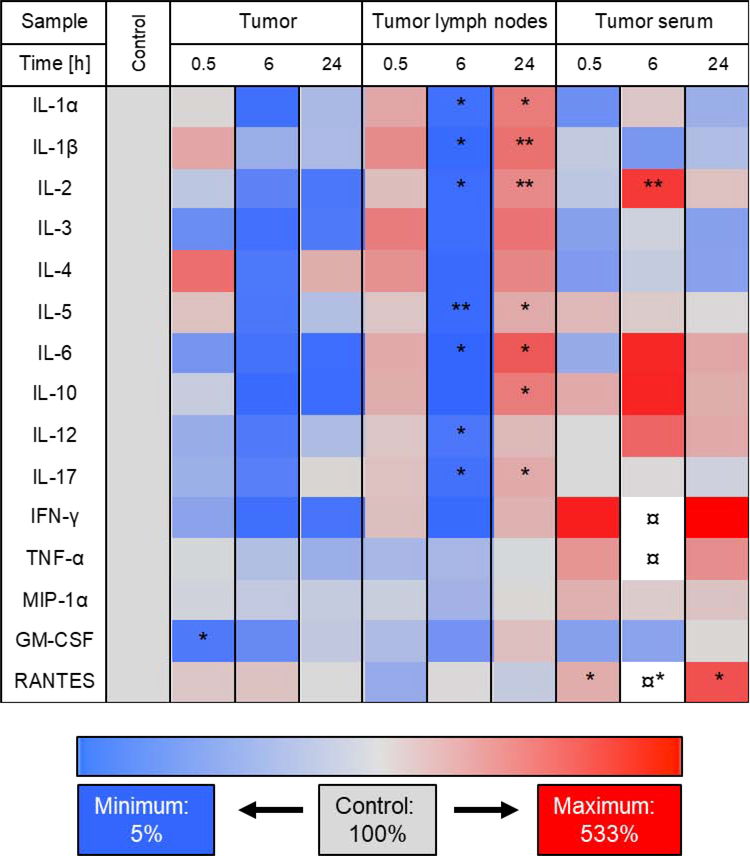
FIG. 6.
Heat map of the screening results of therapy-induced cytokine expression changes in tumors, lymph nodes and serum. Cytokine expressions were assessed in tumors, tumor-associated lymph nodes (tumor lymph nodes) and in serum of tumor-bearing mice (tumor serum) prior to treatment (control) and 0.5, 6, and 24 h after treatment with UTMD-mediated delivery of miR-122-/anti-miR-21-loaded NPs. Decrease in cytokine expression is indicated in blue and increase is shown in red. As a reference, the cytokine expression in control tissues (without treatment) was set to 100% (shown in grey). The currency sign (¤) indicates that the cytokine expression was higher than the depicted maximum of 533% (IFN-γ at 1918%, TNF-α at 921%, RANTES at 1112%). For statistical analysis, all treated samples were compared to the untreated control.

