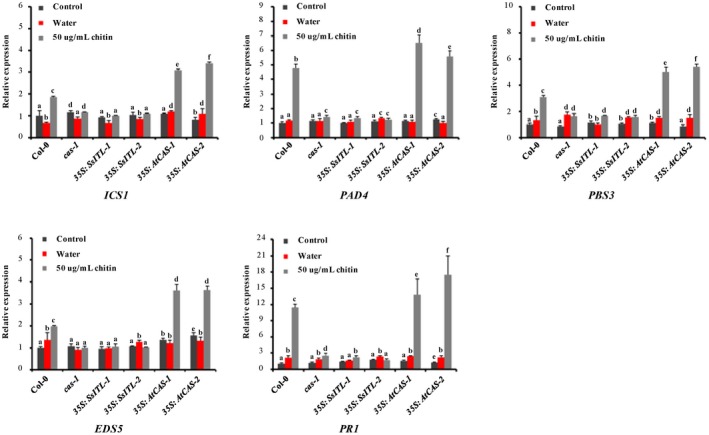
Figure 6.

Analysis of the expression levels of five salicylic acid signalling pathway‐related genes after chitin treatment. Relative transcript accumulation of ICS1, PAD4, PBS5, EDS5, and PR1 genes determined by quantitative reverse transcription PCR at 12 hr post‐infiltration with 50 µg/ml chitin. The expression levels of GAPDH were used to normalize the expression levels of these genes in the different plants. The expression level in the wild‐type plant Col‐0 without treatment was set to 1. Three independent replicates were performed. Values are means ± SD. Different letters on the same graph indicate statistical significance (one‐way analysis of variance; post hoc = Duncan α [0.05])
