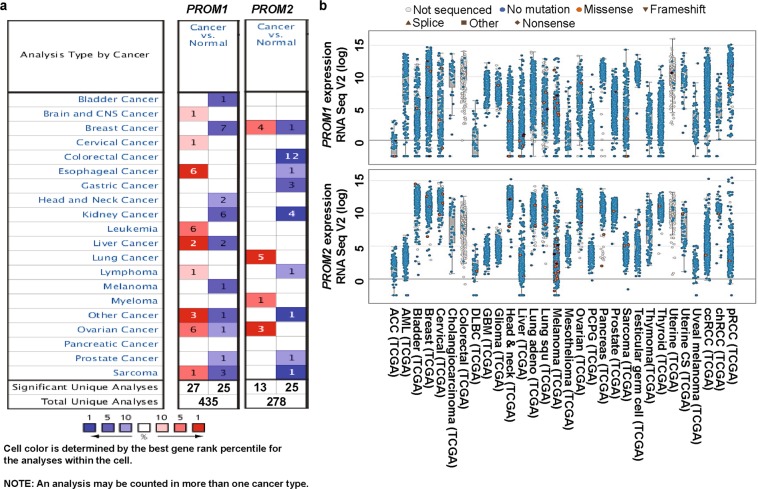
Fig. 1.
Transcription levels of PROM1 and PROM2 in different types of cancers (Oncomine and TCGA databases). a This graphic was generated using Oncomine, indicating the numbers of datasets with statistically significant (p < 0.01) overexpression (red) or underexpression (blue) of PROM1 and PROM2 mRNA (cancer vs. corresponding normal tissue). The threshold was designed with the following parameters: p-value = 0.01, fold change = 2, and gene ranking = 10%. The numbers in the boxes represent the number of analyses that met these thresholds. b Analysis of PROM1 and PROM2 mRNA levels in 30 types of human cancer using data from cBioPortal (http://www.cbioportal.org/index.do). Every dot represents a single study. White dots represent those without gene sequencing data, blue dots represent normal gene sequencing results (no mutation), and orange spots represent missense mutations. Flowchart: merged spots represent frame shifts, isosceles triangles represent splice sites, diamonds represent nonsense mutations, and rectangles represent others. The median and interquartile ranges are shown in each box

