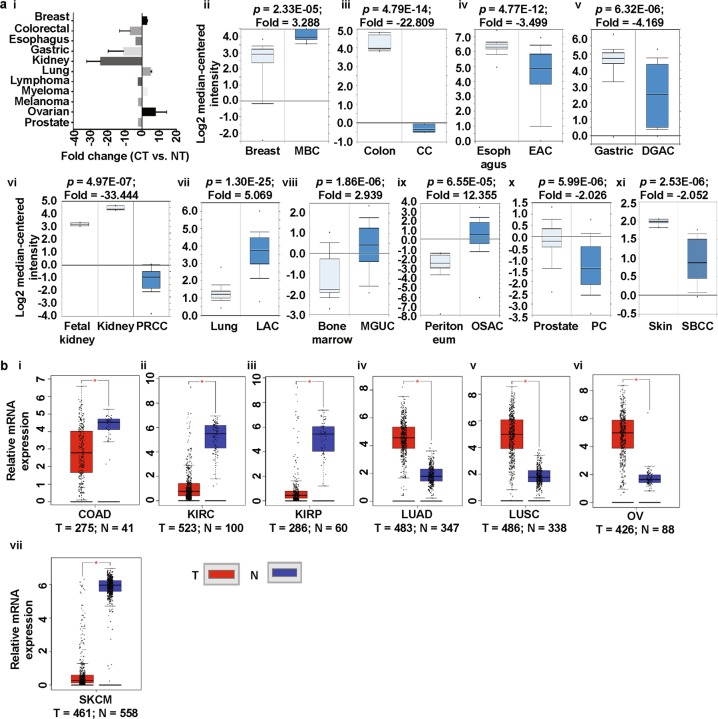
Fig. 3.
PROM2 expression analysis in different cancer types (Oncomine and TCGA databases). a The box plot comparing PROM2 expression in normal (left plot) and cancer tissues (right plot) was derived from the Oncomine database. The fold change of PROM2 in various cancer types was identified from our analyses presented in Supplementary Table 2 (i). Analysis of MBC relative to normal breast (ii), CC relative to normal colon (iii), EAC relative to normal esophagus (iv), DGAC relative to normal stomach (v), PRCC relative to normal kidney (vi), LAC relative to normal lung (vii), MGUC relative to normal bone marrow (viii), OSAC relative to normal peritoneum (ix), PC relative to normal prostate (x) and SBCC relative to normal skin (xi). The threshold was designed with the following parameters: p-value = 0.01, fold change = 2, and gene rank = 10%. b PROM2 expression data from the Cancer Genome Atlas (TCGA) database. Box plots showing PROM2 mRNA expression in various tumors (T) and corresponding normal (N) tissues using TCGA data from GEPIA (i-vii). The threshold was designed with the following parameters: p-value = 0.01, fold change = 2. MBC mucinous breast carcinoma, CC colon carcinoma, EAC esophageal adenocarcinoma, DGAC diffuse gastric adenocarcinoma, PRCC papillary renal cell carcinoma, LAC lung adenocarcinoma, MGUC monoclonal gammopathy of undetermined significance, OSAC ovarian serous adenocarcinoma, PC prostate carcinoma, SBCC skin basal cell carcinoma, CESC cervical squamous cell carcinoma and endocervical adenocarcinoma, CHOL cholangiocarcinoma, KIRC kidney renal clear cell carcinoma, KIRP kidney renal papillary cell carcinoma, LUAD lung adenocarcinoma, LUSC lung squamous cell carcinoma, OV ovarian serous cystadenocarcinoma, PAAD pancreatic adenocarcinoma, SARC sarcoma, SKCM skin cutaneous melanoma, THYM thymoma, UCEC uterine corpus endometrial carcinoma

