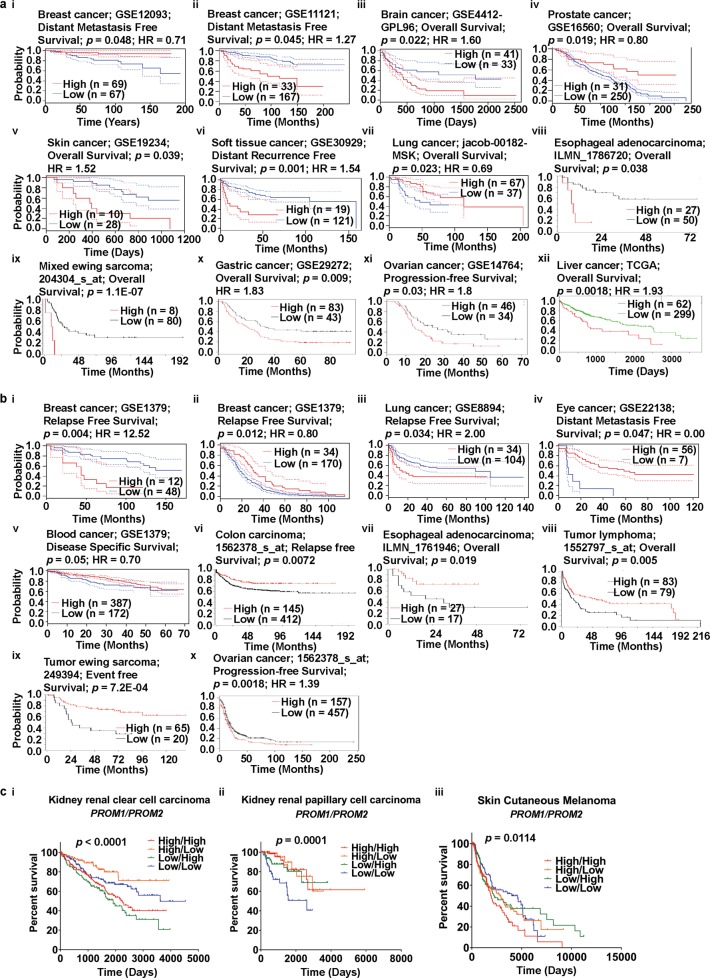
Fig. 4.
Correlation of PROM1 and PROM2 expression with prognosis of various cancers (PrognoScan, R2: Kaplan Meier Scanner, Kaplan–Meier plotter, SurvExpress, and OncoLnc). a Survival curves comparing patients with high (red) and low (blue) PROM1 expression were plotted using breast (i and ii), brain (iii), prostate (iv), skin (v), soft tissue (vi), and lung (vii) cancer data from PrognoScan; esophageal cancer (viii) and sarcoma (ix) data from R2: Kaplan Meier Scanner; gastric (x) and ovarian (xi) cancer data from Kaplan-Meier Plotter; and liver cancer (xii) data from SurvExpress. Cox p-value threshold < 0.05. b Survival curves comparing patients with high (red) and low (blue) PROM2 expression were plotted using breast (i and ii), lung (iii), eye (iv), and blood (v) cancer data from PrognoScan; colon cancer (vi), esophageal cancer (vii), lymphoma (viii), and sarcoma (ix) data from R2: Kaplan Meier Scanner; and ovarian cancer (x) data from Kaplan-Meier plotter. Cox p-value threshold < 0.05. c Co-expression of PROM1 and PROM2 with respect to the cancer patient prognosis. Multivariate survival curves comparing the prognosis of patients with high/high (red), high/low (orange), low/high (green), and low/low (blue) expression co-expression patterns of PROM1/PROM2 in KIRC (i), KIRP (ii), and SKCM (iii). Clinical outcome data were retrieved from TCGA using OncoLnc. p < 0.05 represents statistical significance. Abbreviations: KIRC - kidney renal clear cell carcinoma; KIRP - kidney renal papillary cell carcinoma; SKCM - skin cutaneous melanoma

