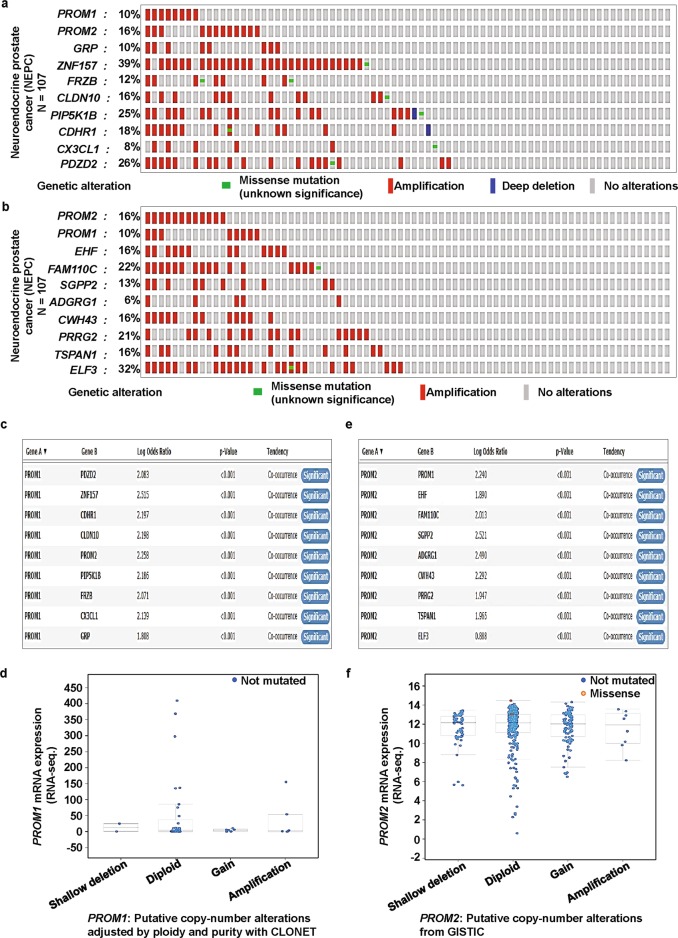
Fig. 6.
PROM1 and PROM2 gene signatures are predominantly amplified and significantly co-expressed in neuroendocrine prostate cancer (NEPC) and bladder cancer. a We used the Oncoprint feature of cBioPortal to determine the copy number alteration frequency of each individual gene of the PROM1 (a) cluster (PROM1, PROM2, GRP, ZNF157, FRZB, CLDN10, PIP5K1B, CDHR1, CX3CL1, and PDZD2) and the PROM2 (b) cluster (PROM2, PROM1, EHF, FAM110C, SGPP2, ADGRG1, CWH43, PRRG2, TSPAN1, and ELF3) within selected cancer subtypes. The alterations included missense mutations (green), amplifications (red), deep deletions (blue), or no alterations (grey). c and d Mutual exclusivity panel analysis revealed the co-occurrence of alterations of PROM1 gene signatures and correlations between PROM1 gene copy number and mRNA expression. The correlation between PROM1 CNAs and mRNA levels was investigated using the cBioPortal for Cancer Genomics. Data are shown for the 107 NEPC samples in which CNAs were available. The search criteria were: “neuroendocrine prostate cancer (NEPC), mutation, and putative copy-number alterations adjusted by ploidy and purity with CLONET.” The x-axis is divided according to the copy number status of the tumor and the Y-axis represents PROM1 mRNA levels. e and f Mutual exclusivity panel analysis revealed the co-occurrence of alterations of PROM2 gene signatures and correlation between PROM2 gene copy number and mRNA expression. The correlation between PROM2 CNAs and mRNA levels was investigated using cBioPortal for Cancer Genomics. Data are shown from the 402 bladder cancer (TCGA PanCan Atlas) samples in which CNAs were available. The search criteria were “Bladder cancer (TCGA PanCan Atlus), mutation, putative copy-number alterations from GISTIC, and mRNA expression z-Scores (U133 microarray only).” The x-axis is divided according to the copy number status of the tumor and the Y-axis represents PROM2 mRNA level

