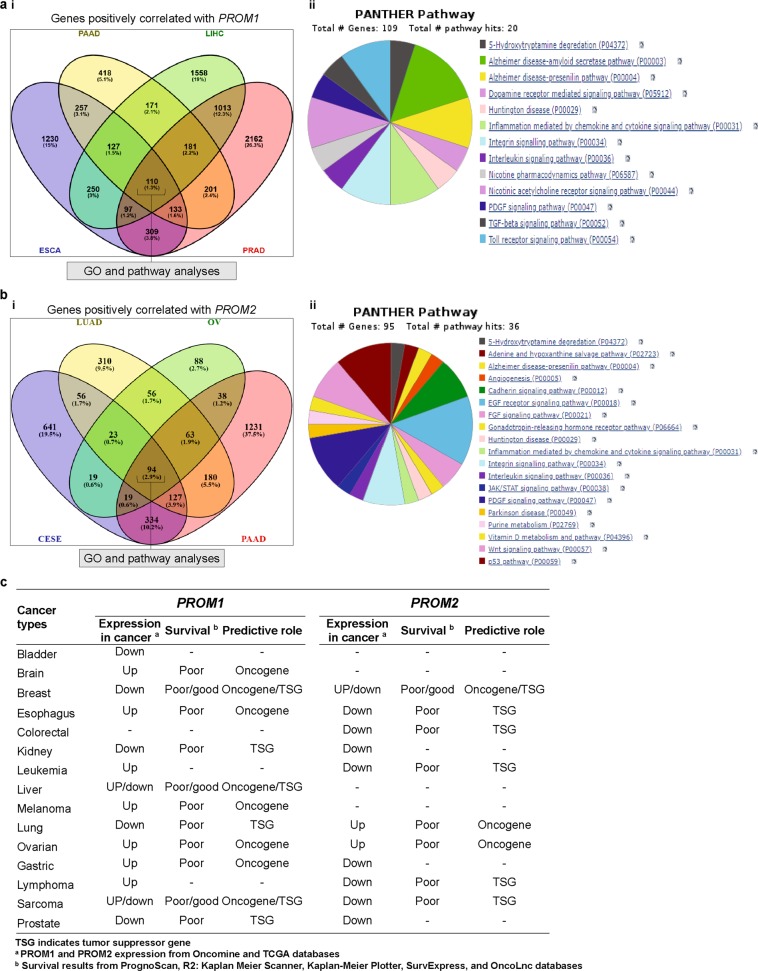
Fig. 8.
Analysis of genes that positively correlated with PROM1 and PROM2 and their predicted pathway analysis using PANTHER. a Venn diagram of genes that positively correlated with PROM1, showing coincident genes in ESCA, PAAD, LIHC, and PRAD (i). Pathway analysis using PANTHER and subsequent classification based on their pathways (ii). b Venn diagram of genes that positively correlated with PROM2, showing coincident genes in CESE, LUAD, OV, and PAAD (i). Pathway analysis using PANTHER and subsequent classification based on their pathways (ii). c Summary of predictive value of PROM1 and PROM2 in different cancers, based on systematic genetic analyses

