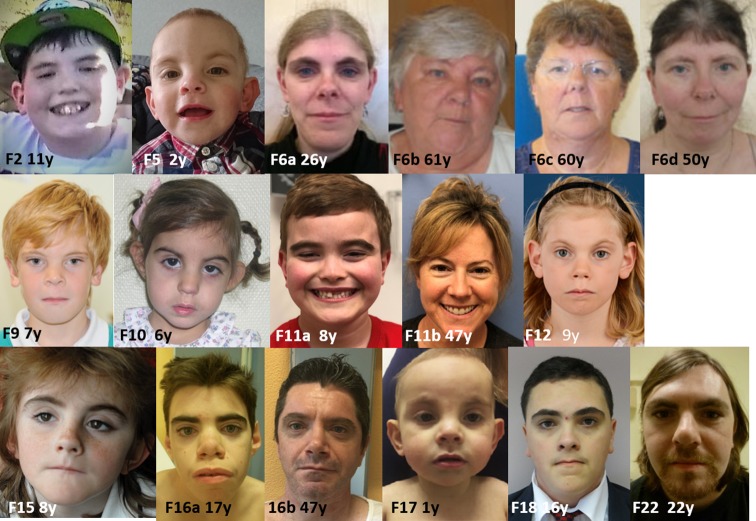
Fig. 3.
Clinical phenotype in RAD21 patients. Anterior–posterior facial views. F family identification number, y age in years. Family numbers correspond to family numbers in the tables. Ages are indicated below each picture. Intrafamilial variability is illustrated by the comparison of facial morphology between the members of family F6 and of family F16. Interfamilial variability is illustrated by the comparison of facial morphology between patients F15 and F16a/b who harbor the p.(Arg586*) variant. Pictures of members of F6 and of F17 were republished with permission (Gudmundsson et al. 2018 and Boyle et al. 2017)

