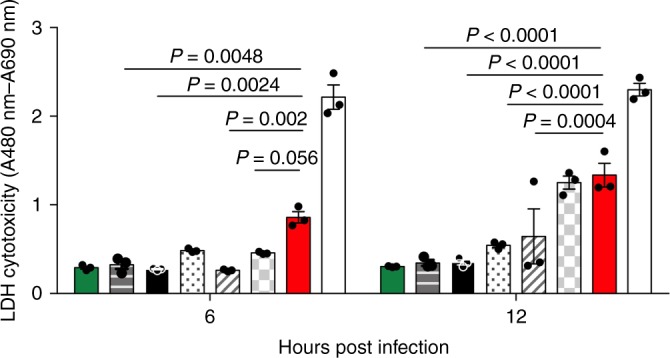
Fig. 6. Level of lung epithelial cell cytotoxicity during infection varies with serotype.

A549 lung epithelial cells were infected with 6 × 10⁵ CFU S. pneumoniae and, at 6 and 12 h post infection, samples of cell culture supernatant were removed and amount of LDH (an indicator of cytotoxic damage) measured. Infections were performed in triplicate wells and error bars represent the mean ± SEM from three independent experiments. Bars, from left to right, are non-infected control cells (green), serotype 1 (ST306) infected (horizontal bars), 2(D39) infected (black), 6B infected (dotted bars), 5 infected (diagonal bars), 7F infected (grey squared bars) and 1(ST217S) infected (red bars). White bars show the LDH positive control. Statistical analysis was performed using Two-way ANOVA and Dunnett’s multiple comparison test. Source data are provided as a Source Data file.
