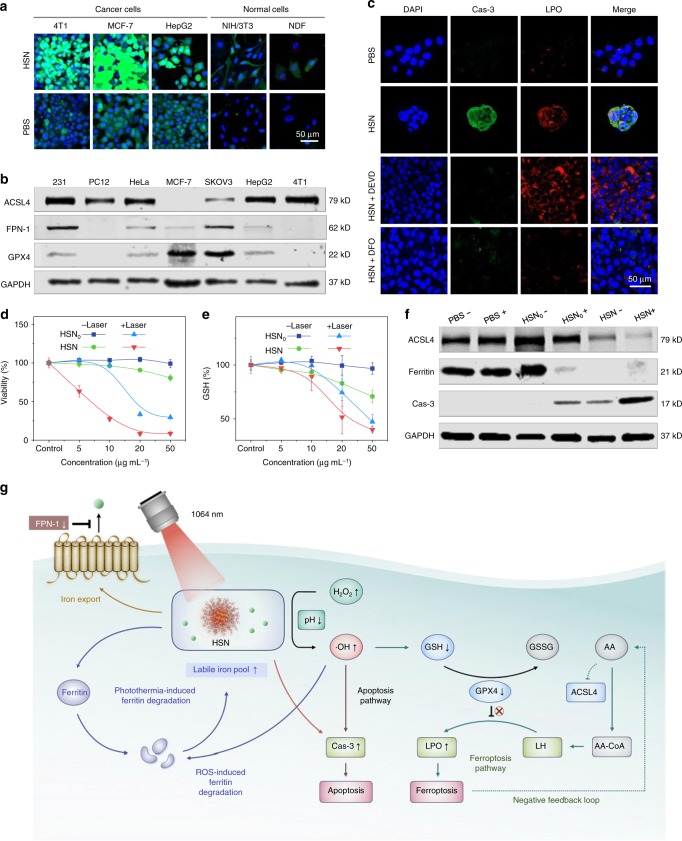
Fig. 3. In vitro NIR-II photothermal ferrotherapy.
a Confocal laser scanning microscopy (CLSM) images of different types of cancer cells and normal cells after incubation with HSN ([pTBCB] = 50 µg mL−1) or PBS for 24 h. ROS was indicated by green fluorescence from DCF-DA staining. Nuclei were stained with 4′,6-diamidine-2′-phenylindole dihydrochloride (DAPI) and indicated by blue fluorescence. 4T1: murine mammary carcinoma cell line; MCF-7: human breast adenocarcinoma cell line; HepG2: human hepatocellular carcinoma cell line; NIH/3T3: murine fibroblast cell line; NDF: normal human dermal fibroblast cell line. b Western immunoblot analysis of expression levels of ferroptosis-related proteins (ACSL4, FPN-1, GPX4) in a panel of cancer cell lines. MDA-MB-231 (231): human breast adenocarcinoma cell line; PC12: rat pheochromocytoma cell line; HeLa: human cervical adenocarcinoma cell line; SKOV3: human ovarian adenocarcinoma cell line. Source data were provided in Source Data File. c CLSM images of 4T1 cells after incubation with PBS, HSN, HSN with apoptosis inhibitor DEVD (100 µM), HSN with ferroptosis inhibitor deferoxamine (DFO) (100 µM) for 24 h, respectively. [pTBCB] = 50 µg mL−1. Expression of Cas-3 was indicated by immunofluorescence staining (green fluorescence), and lipid peroxidation was stained with a red-fluorescent probe BODIPY 665/676. Cell viabilities (d) and relative GSH levels (e) of 4T1 cells after incubation with HSN0 or HSN at various concentrations for 24 h with or without 1064 nm photoirradiation (1 W cm−2, 6 min). [pTBCB] = 50 µg mL−1. f Western immunoblots analysis of expression levels of ferroptosis and apoptosis related proteins in 4T1 cells in d and e. Plus and minus symbol indicated with and without photoirradiation, respectively. Source data were provided in Source Data File. g Proposed molecular mechanisms of HSN-mediated NIR-II photothermal ferrotherapy. GSSG glutathione disulfide, AA arachidonic acid, AA-CoA arachidonyl-CoA, LH phospholipid. Error bars indicated standard deviations of three independent measurements.

