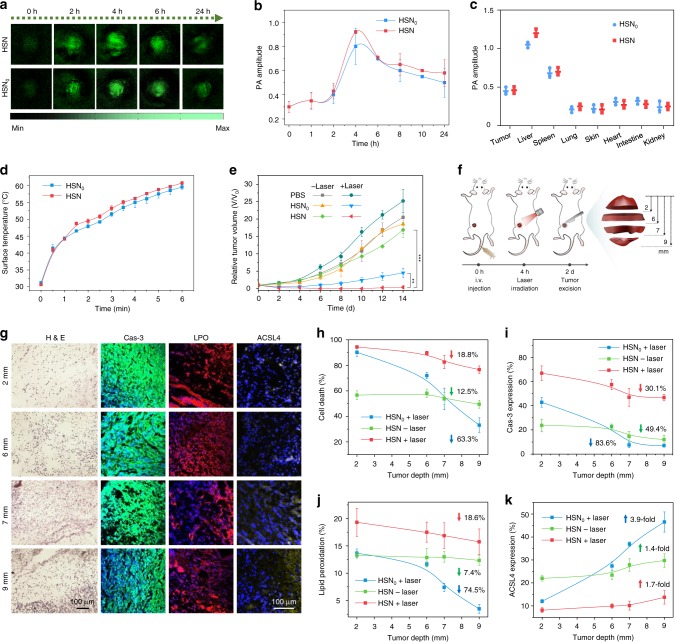
Fig. 4. In vivo NIR-II PA imaging-guided photothermal ferrotherapy.
a Time-course NIR-II PA images of tumor region on living mice bearing 4T1-xenograft tumor after intravenous administration of HSN or HSN0 ([pTBCB] = 250 µg mL−1, 200 µL per mouse, n = 3). Wavelength: 1064 nm. b Quantification of PA amplitudes in a (n = 3). c Biodistribution study of mice in a at 24 h post-administration of HSN or HSN0 (n = 3). d Surface tumor temperature of 4T1 tumor-bearing mice upon 1064 nm photoirradiation (1 W cm−2, 6 min) at 4 h after intravenous administration of HSN or HSN0 ([pTBCB] = 250 µg mL−1, 200 µL per mouse, n = 3). e Tumor growth curves of mice after photothermal ferrotherapy and monotherapies (n = 3). P-values were calculated by Student’s two-sided t-test. **P < 0.01, ***P < 0.001 (n = 3). f Scheme of photothermal depths of tumor. g H&E staining and immunofluorescent staining (Cas-3, LPO, and ACSL4) images of tumor sections at different photothermal depths after monotherapies or photothermal ferrotherapy. Cas-3, LPO, and ACSL4 staining was indicated with green, red, and yellow false colors, respectively. h–k Quantification of cell death percentage (h), Cas-3 expression (i), LPO extent (j), and ACSL4 expression (k) of tumor sections at different photothermal depths after monotherapies or photothermal ferrotherapy. Upwards or downwards arrows indicated the increased or decreased percentage at 9 mm relative to 2 mm. Error bars indicated standard deviations of three independent measurements.

