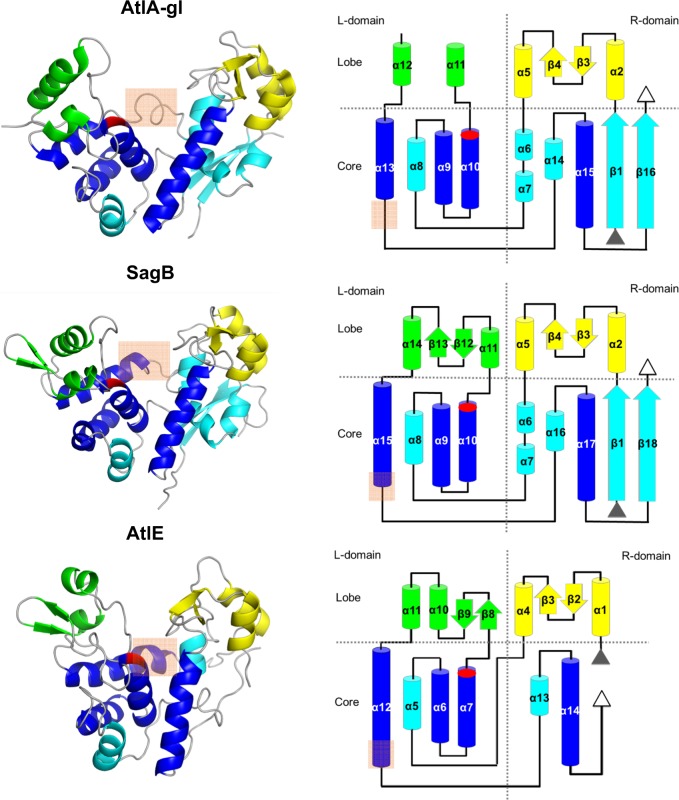
Fig. 1. Structures of AtlA-gl, SagB and AtlE.
The left column shows the ribbon presentation of the structures, whereas the right column shows topology diagrams. The highly conserved helices in the lysozyme-type fold enzymes are depicted in blue and the other core secondary structure elements are shown in cyan. The L-lobe secondary structure elements are shown in green and the R-lobe elements are in yellow. The active site glutamate is marked in red. An orange rectangle marks the region of differences between helices α13 in AtlA-gl, α15 in SagB, and α12 in AtlE.

