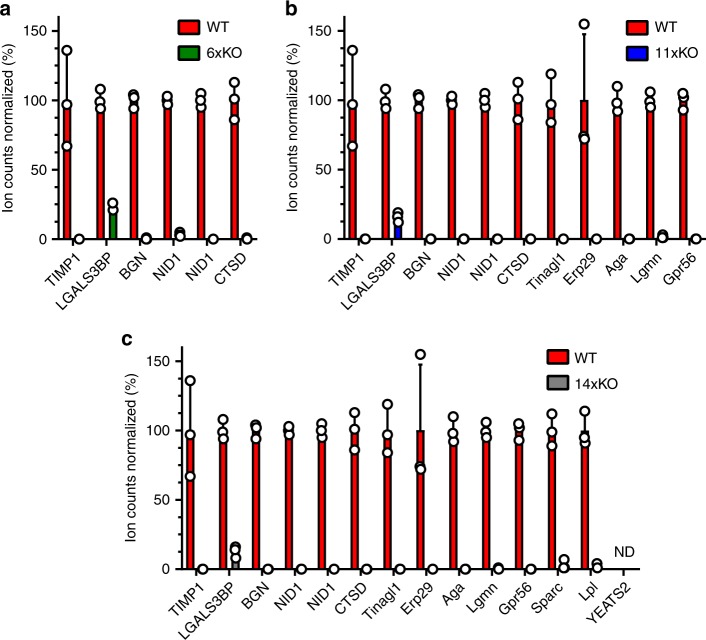
Fig. 2. Verification of knockouts by mass spectrometry.
Supernatant samples prepared from WT (red bars) were subjected to MS and compared to the a 6xKO (green bars), b 11xKO (blue bars) and c 14xKO (gray bars) cell lines with respect to the indicated targets. Ion counts were normalized to the levels detected in WT. The target YEATS2 was not detected (ND) in both WT and the 14xKO cell line. All data are presented as mean values ± SD (n = 3 independent experiments). Source data are provided as a Source Data file.

