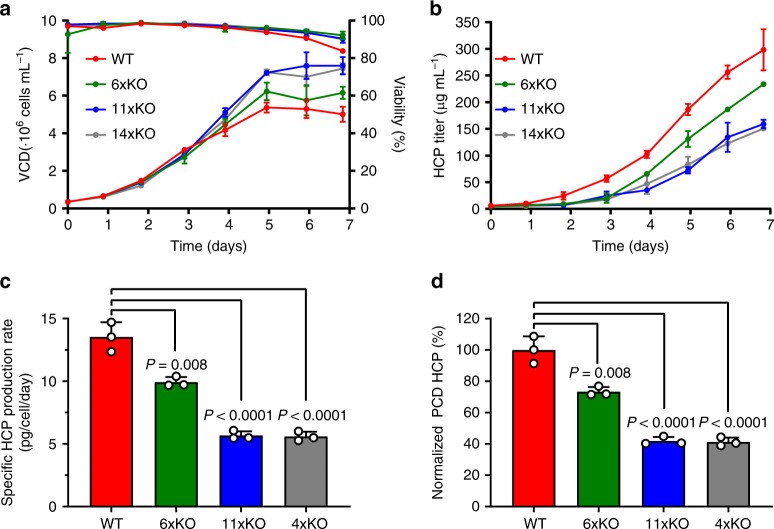
Fig. 3. Knockout cell lines display improved growth and HCP profile.
a Viability and VCD, b HCP profile, c normalized HCP content on day 7, and d normalized specific HCP productivity of WT (red), 6xKO (green), 11xKO (blue), and 14xKO (gray) cell lines. Viability, VCD and HCP content were measured from day 0 to day 7 in shake flasks. The specific HCP productivity was determined as the slope of HCP concentration versus the integral number of viable cell (IVCD) calculated from day 0 to day 7, and expressed as pg HCP per cell and per day (HCP pcd). Specific HCP production was normalized to the levels detected in WT. Data are presented as mean values ± SD (n = 3 independent experiments). Statistical analysis (c, d) was performed using one-way ANOVA followed by Tukey’s post-hoc test. Source data are provided as a Source Data file.

