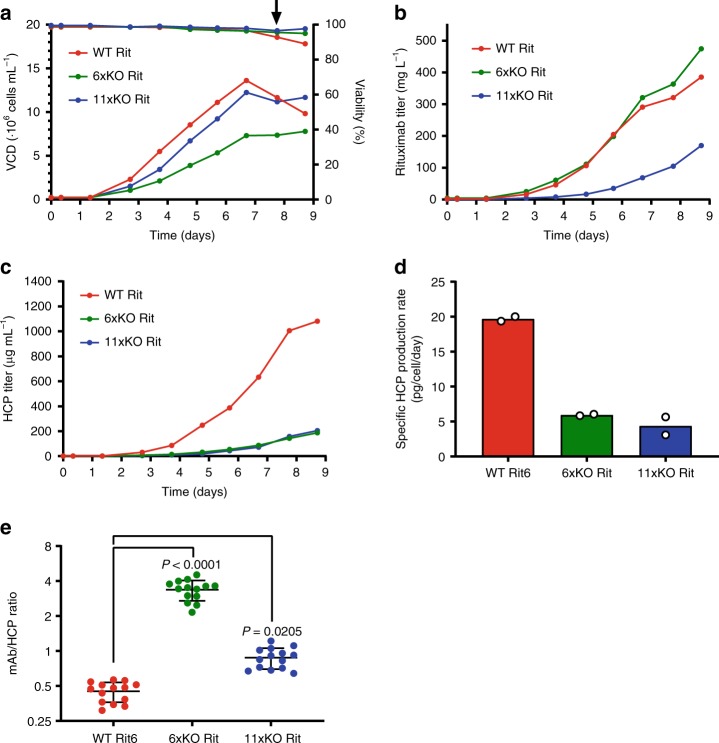
Fig. 5. The HCP-reduced phenotype is maintained under fed-batch cultivation.
a Viability and VCD, b Rituximab titer, c HCP profile, d specific HCP productivity, and e the mAb/HCP ratio of WT Rit (red), 6xKO Rit (green), and 11xKO Rit (blue) cell lines. Each cell line was cultivated in duplicate. Viability, VCD, titer, and HCP content were measured daily in a DASGIP bioreactor. Mean of technical duplicates is shown. At the indicated timepoint (arrow), 100 mL of the culture was harvested for mAb purification. The HCP/mAb ratio was calculated by dividing the mAb titer by the HCP titer for all 7 time points in duplicate. Data (e) is presented as mean values ± SD (n = 14 independent samples). Statistical analysis was performed using one-way ANOVA followed by Tukey’s post-hoc test. Source data are provided as a Source Data file.

