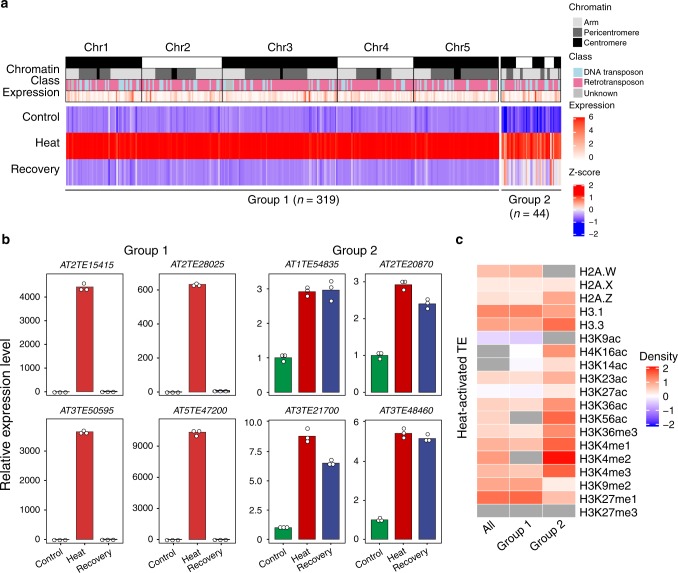
Fig. 2. Characterization of two groups of heat-activated TEs.
a Heatmap of heat-activated TEs in Control, Heat, and Recovery. The chromatin track shows the genomic locations of heat-activated TEs. The class track shows the three classes of the heat-activated TEs. The expression track shows the expression levels of heat-activated TEs in log2 (CPM + 1). The bottom three tracks show relative expression levels (Z-scores) for Control, Heat, and Recovery and range from −2 (blue) to 2 (red). Most heat-activated TEs, classified into Group 1, are silenced again during recovery. Some heat-activated TEs, classified into Group 2, exhibited persistent activation or were not completely restored during recovery. b Expression dynamics of randomly selected Group 1 and Group 2 TEs as determined by RT-qPCR. The expression value of each replicate was normalized to the expression level of Col-0. Circles denote relative expression values. Bars indicate mean values of three technical replicates. c The enrichment (red) and depletion (blue) patterns of epigenetic features in Group 1 and Group 2 TEs compared with total TEs in Arabidopsis. Relative density ranges from −2 to 2. Gray indicates that the epigenetic feature is neither enriched nor depleted (two-sided Mann–Whitney U test, p > 0.05). Source data underlying b and c are provided as a Source Data file.

