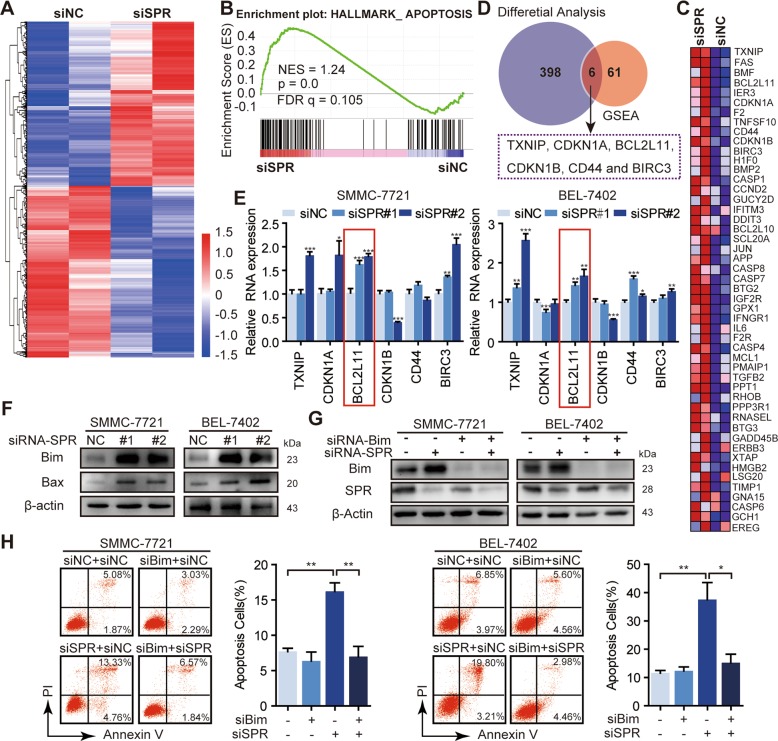
Fig. 4. Bim was negatively regulated by SPR.
a Heat map of the fold changes of gene expressions in SMMC-7721 cells induced by SPR knockdown detected by RNA-seq. b Biological process enrichment plots (using oncogenic “H” from the Molecular Signatures database) in RNA-seq data with siSPR treatment versus the negative control (siNC) treatment in SMMC-7721 cells. The plots indicate a significant (FDR q < 0.25) enrichment of apoptosis signatures after siSPR treatment. c GSEA analysis of RNA-seq data affected by SPR knockdown. A heat map showing the enriched genes in the apoptosis process from the Molecular Signatures database with siSPR compared to siNC-treated SMMC-7721 cells. d A Venn diagram showing the overlap of genes between differential analysis and GSEA analysis based on RNA-seq data. e The mRNA expression of TXNIP, CDKN1A, BCL2L11, CDKN1B, CD44, and BIRC3 in HCC cells treated with siSPR or siNC by qPCR. f The protein levels of Bim and its downstream Bax in different groups were detected by western blots. g Bim expression was significantly inhibited after treatment with siBim. h Bim suppression abolished the induction of apoptosis in SPR-depleted HCC cells analyzed by flow cytometry using annexin V/PI staining. Data are represented as the mean ± SD of three independent experiments. The p-values < 0.05 were considered statistically significant for all tests.

