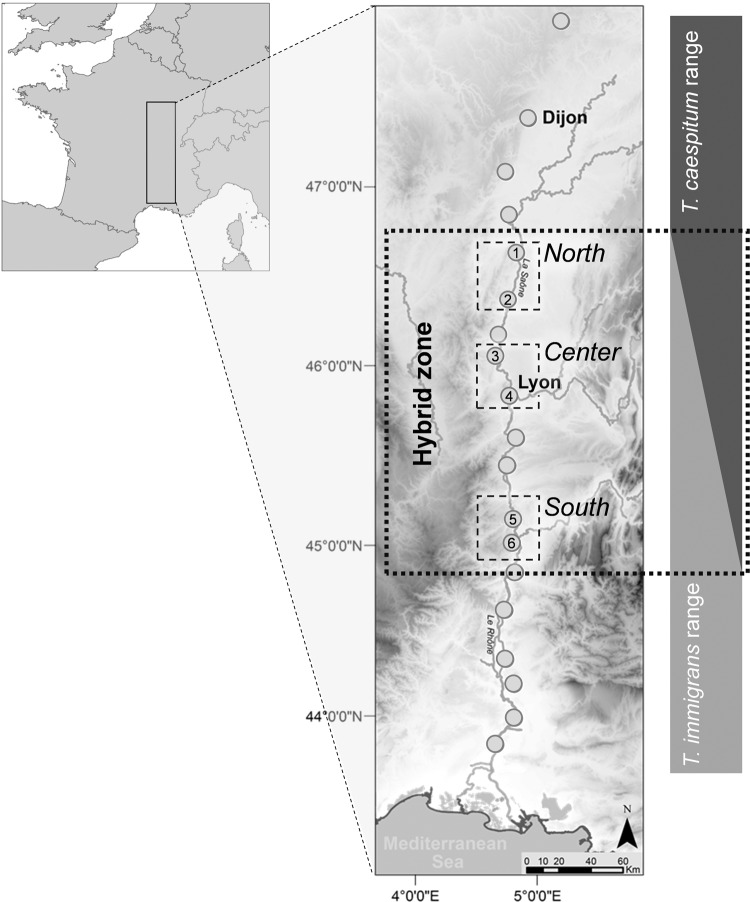
Fig. 1. Map of the study area.
Species ranges are indicated on the right, based on populations indicated by gray dots. The three sampled areas (North, Center, and South) are indicated as small dashed squares within the hybrid zone (large dotted square). 1: Tournus, 2: Mâcon, 3: Villefranche-sur-Saône, 4: Lyon, 5: Tournon sur Rhône, 6: Valence. The main rivers are indicated in dark gray; altitude is indicated by grayscale (black = high altitude).

