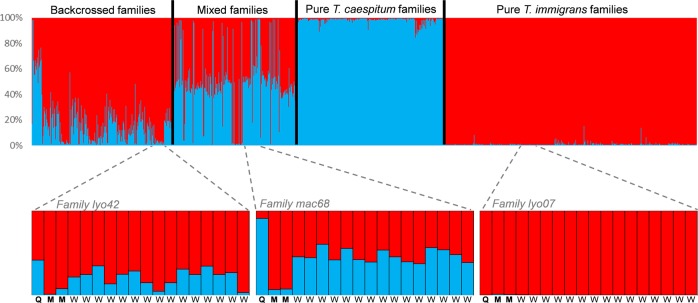
Fig. 2. Top—barplot obtained from STRUCTURE Bayesian clustering based on the 1008 worker genotypes and the 198 reconstructed genotypes of parents (68 females and 130 males).
Each vertical line corresponds to an individual. Colors indicate membership to each cluster (T. immigrans in red, T. caespitum in blue). Bottom—detailed barplots of three colonies representative from the different types of families (left: backcrossed, middle: mixed, and right: pure families), for workers (W), queens (Q), and males (M). The ID of the family is indicated in gray.

