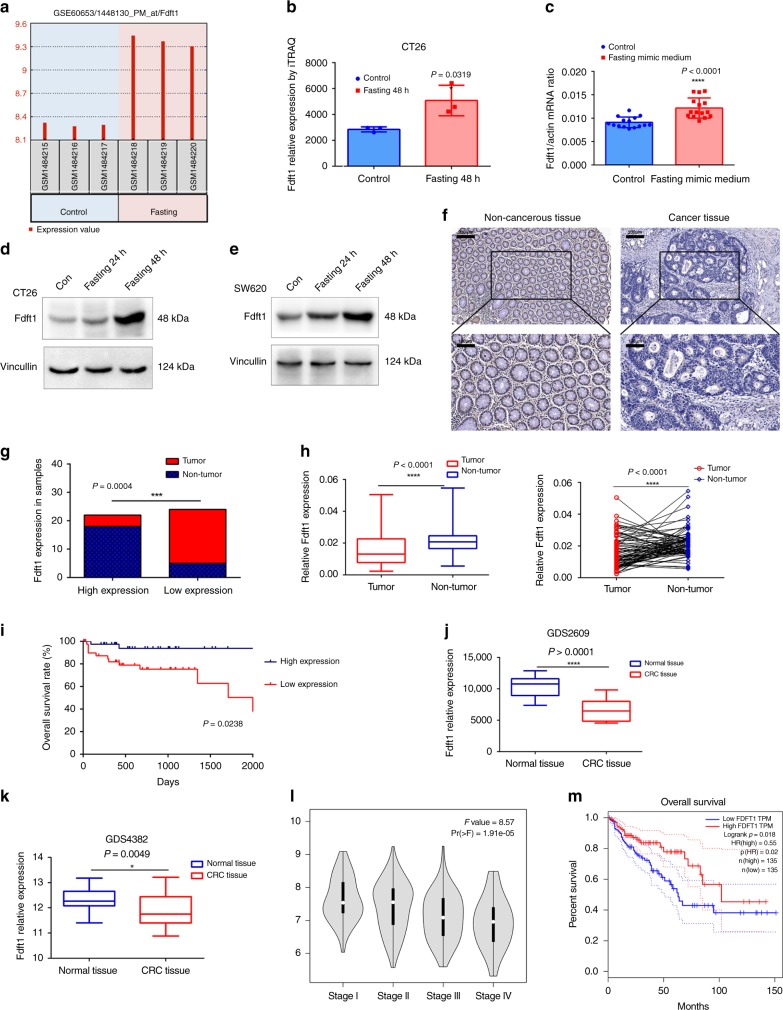
Fig. 2. Fasting upregulates the level of FDFT1, which is correlated with prognosis in CRC.
a The expression of FDFT1 was increased significantly in the fasting group compared with that in the control group in the GSE60653 data set (n = 3). b The relative expression of FDFT1 was also increased greatly in the fasting group compared with that in the control group by iTRAQ (n = 3; P = 0.0319). c The mRNA expression of FDFT1 in dissected tumor tissue from the fasting mimic group and the control group was measured by qRT-PCR (n = 15; P < 0.0001). d, e Fasting mimic medium also increased the protein level of FDFT1 in CT26 and SW620 cells. f Representative graph of the IHC analysis carried out in human CRC and noncancerous tissues (n = 23; upper: scale bar is 200 µm; lower: scale bar is 100 µm). g The expression of FDFT1 was downregulated in most of the tumor tissues (19/23), but was upregulated in most of the adjacent noncancerous tissues (18/23) (n = 23; P = 0.0004). h The relative expression levels of FDFT1 mRNA in CRC tissues and matched adjacent noncancerous tissues were determined by qRT-PCR (n = 81; both P < 0.0001). i Kaplan–Meier analysis of the overall survival of patients with CRC in the FUSCC cohort according to FDFT1 expression. The median expression level was used as the cutoff. High FDFT1 expression predicted better prognoses for CRC patients in the FUSCC cohort. (high FDFT1 patients = 39, low FDFT1 patients = 42; P = 0.0238, log-rank test) j, k The expression of the FDFT1 gene was significantly lower in CRC tissues than in normal tissues in the GDS2609 and GDS4382 data sets (P < 0.0001; P = 0.0049). l Analysis of the correlation of FDFT1 expression with TNM stage in CRC patients. Lower FDFT1 expression was correlated with higher TNM stage (P = 1.91 × 10⁻⁵). m Survival analysis of FDFT1 data from the TCGA database stratified by FDFT1 expression. High FDFT1 expression indicated a better prognosis. (P = 0.018, log-rank test). Error bars, mean ± SD, the data are from three independent experiments. Two-sided t tests. Box denotes 25th to 75th percentile, horizontal bar is median in h, j, and k. Kaplan–Meier analysis and log-rank tests were used in panels i, m. *P < 0.05, **P < 0.01, ***P < 0.001, ****P < 0.0001, compared with the control group (or non-tumor/normal tissue).

