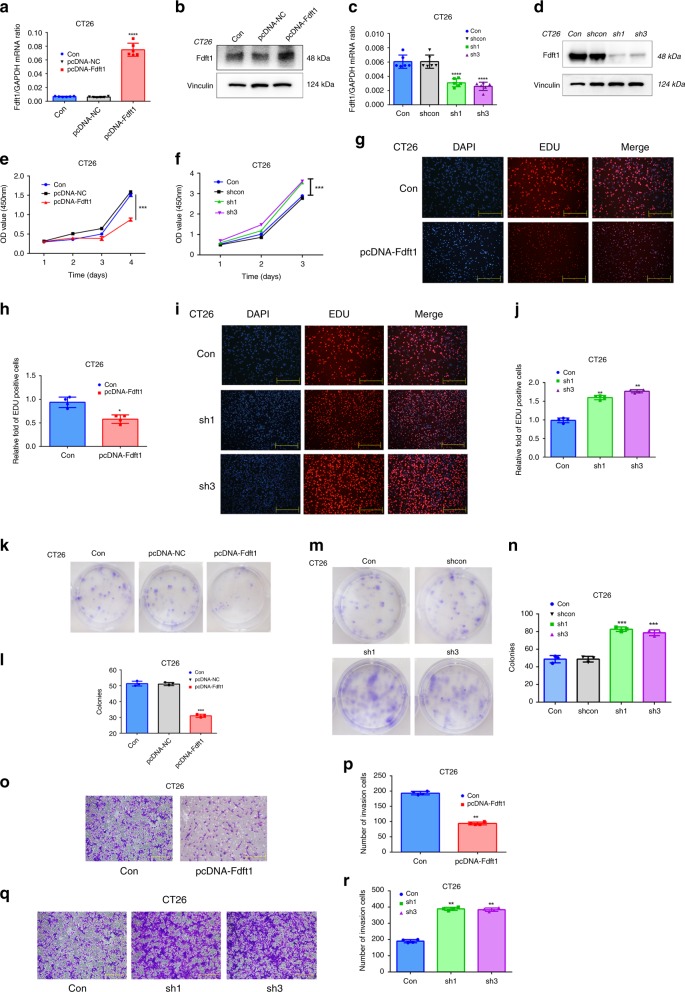
Fig. 3. FDFT1 negatively regulates the proliferation of CRC cells.
a, b The efficiency of FDFT1 overexpression in CT26 cells was measured by qRT-PCR and western blotting (P < 0.0001). c, d The efficiency of FDFT1 knockdown in CT26 cells was measured by qRT-PCR and western blotting (both P < 0.0001). e FDFT1 overexpression inhibited CT26 cell proliferation as measured by a CCK8 assay (P = 0.0006). f FDFT1 knockdown increased CT26 cell proliferation as measured by a CCK8 assay (sh1 vs con: P = 0.0008; sh3 vs con: P = 0.0009). g Cell proliferation in control and FDFT1-overexpressing CT26 cells was also evaluated using EdU immunofluorescence staining. Scale bar: 100 µm. h The graph shows the relative fold fraction of EdU-positive cells. i Cell proliferation was also evaluated in control and FDFT1 knockdown CT26 cells using EdU immunofluorescence staining. Scale bar: 100 µm. j The graph shows the relative fold fraction of EdU-positive cells. k FDFT1 overexpression decreased the colony-forming capacity of CT26 cells as measured by a colony-formation assay. l The graph shows the statistical results of the colonies. m FDFT1 knockdown increased the colony-forming capacity of CT26 cells as measured by a colony-formation assay. n The graph shows the statistical results of the colonies (from left to right: P = 0.0003; P = 0.0006). o FDFT1 overexpression inhibited CT26 cell invasion as measured by a Transwell assay. Scale bar: 100 µm. p The graph shows the number of invaded cells. q FDFT1 knockdown increased CT26 cell invasion as measured by a Transwell assay. Scale bar: 100 µm. r The graph shows the number of invaded cells. Error bars, mean ± SD, the data are from three independent experiments. Two-sided t tests. *P < 0.05, **P < 0.01, ***P < 0.001, ****P < 0.0001, compared with the control group.

