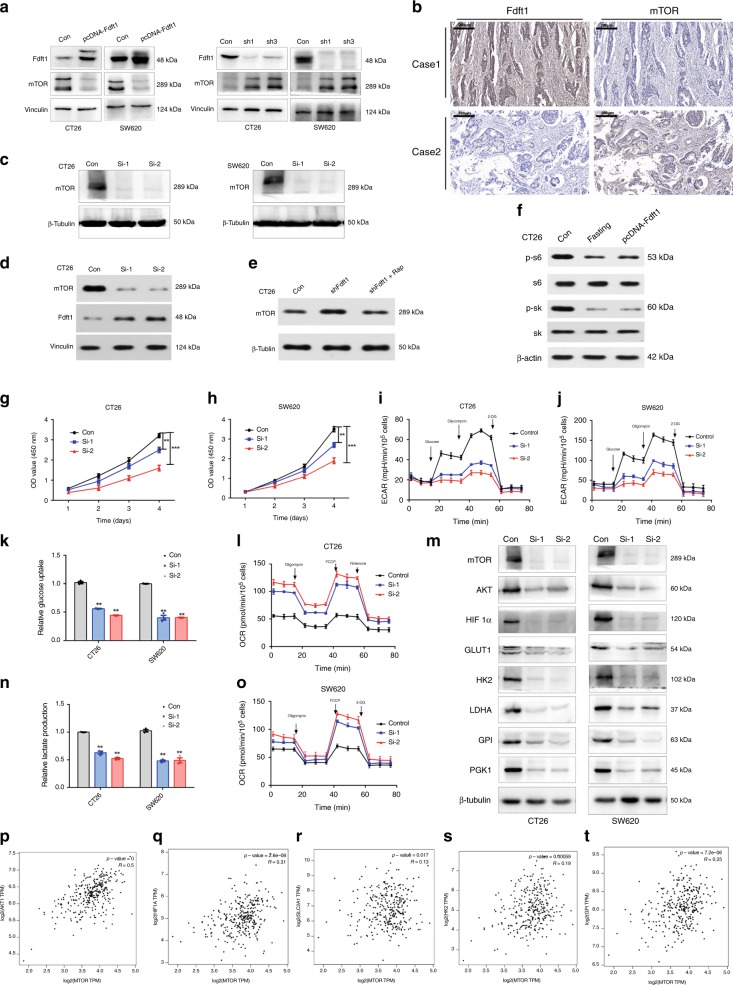
Fig. 5. mTOR expression is inversely correlated with FDFT1 expression.
a FDFT1 overexpression inhibited the protein level of mTOR, whereas FDFT1 knockdown increased the protein level of mTOR in CT26 and SW620 cells. b FDFT1 expression and mTOR expression were negatively correlated in CRC patient samples. Scale bar: 200 µm. c The mTOR silencing efficiency of the siRNA in CT26 and SW620 cells was validated by western blotting. d The effect of mTOR silencing on FDFT1 expression level in CT26 was evaluated by western blotting. e The protein level of mTOR when FDFT1 knockdown combined with or without mTOR inhibitor in CT26. f The protein level of pS6k, S6k, pS6, and S6 under the effect of fasting and FDFT1 overexpression in CRC cells. g, h CCK8 proliferation assays showed that the silencing of mTOR decreased the proliferation of CT26 and SW620 cells. k, n The silencing of mTOR reduced glucose uptake and lactate production in CT26 and SW620 cells. i, j, l, o The silencing of mTOR decreased the ECAR and increased the OCR in CT26 and SW620 cells. m The silencing of mTOR decreased the expression of AKT, HIF1α, and proteins encoded by relevant glycolytic genes, such as GLUT1, HK2, LDHA, GPI, PGK1, in CT26 and SW620 cells. p–t Based on TCGA data set analysis, mTOR expression was positively correlated with AKT1, HIF1α, GLUT1, HK2, and LDHA expression. Error bars, mean ± SD, the data are from three independent experiments. Two-sided t tests. *P < 0.05, **P < 0.01, ***P < 0.001, compared with the control group.

