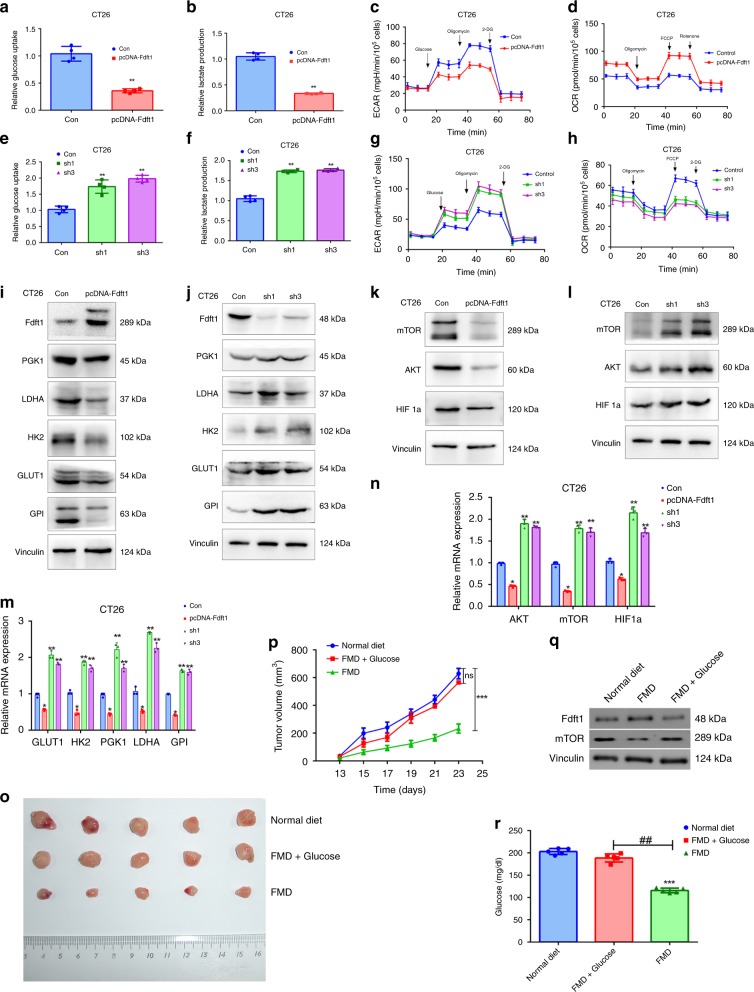
Fig. 6. FDFT1 inhibits glycolysis through suppressing the AKT-mTOR-HIF1α pathway in CRC.
a FDFT1 overexpression reduced glucose uptake in CT26 cells. b FDFT1 overexpression decreased lactate production via glycolysis in CT26 cells. c ECAR was reduced when FDFT1 was overexpressed in CT26 cells. d OCR was increased when FDFT1 was overexpressed in CT26 cells. e FDFT1 knockdown increased glucose uptake in CT26 cells. f FDFT1 knockdown increased lactate production via glycolysis in CT26 cells. g ECAR was increased when FDFT1 was knocked down in CT26 cells. h OCR was decreased when FDFT1 was knocked down in CT26 cells. i, m FDFT1 overexpression inhibited the protein and mRNA expression of mTOR-targeted glycolytic enzymes, including GLUT1, HK2, PGK1, GPI, and LDHA, in CT26 cells. j, m FDFT1 knockdown increased the protein and mRNA expression of mTOR-targeted glycolytic enzymes, including GLUT1, HK2, PGK1, GPI, and LDHA, in CT26 cells. k, n FDFT1 overexpression decreased the protein and mRNA expression of AKT, mTOR, and HIF1α. l, n FDFT1 knockdown increased the protein and mRNA expression of AKT, mTOR, and HIF1α. o Photograph of dissected tumors (the first line: normal diet, the second line: FMD + glucose, the third line: FMD, n = 5). p The tumor volumes were measured every 2 days after the 13th day. The FMD + glucose group can reverse the tumor growth inhibition induced by the FMD (n = 5; ns: P = 0.1838; P = 0.0001). q The protein level of FDFT1 and mTOR in dissected tumor samples from normal diet group, FMD group and FMD + glucose group was measured by western blotting. r The glucose level in these three groups. Error bars, mean ± SD, the data are from three independent experiments. Two-sided t tests. *P < 0.05, **P < 0.01, ***P < 0.001, compared with the control group (or normal diet group). #P < 0.05, ##P < 0.01.

