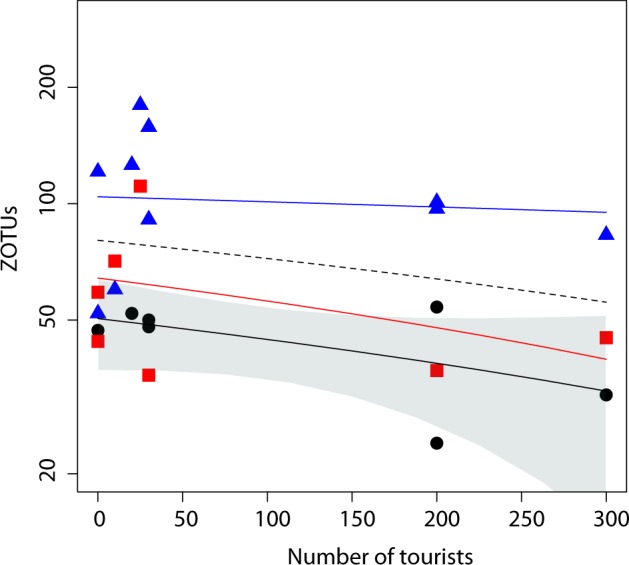
Fig. 2. Number of meiofaunal ZOTUs (on a logarithmic scale) in relationship to the maximum number of tourists per day every 10 m2.

The black dashed line represents the (non-significant) regression line for the entire dataset. Points and lines represent the relationship for each water depth: swash (black dots), shallow (red squares), and deep (blue triangles). The significant regression line for swash water level is reported with 95% confidence interval.
