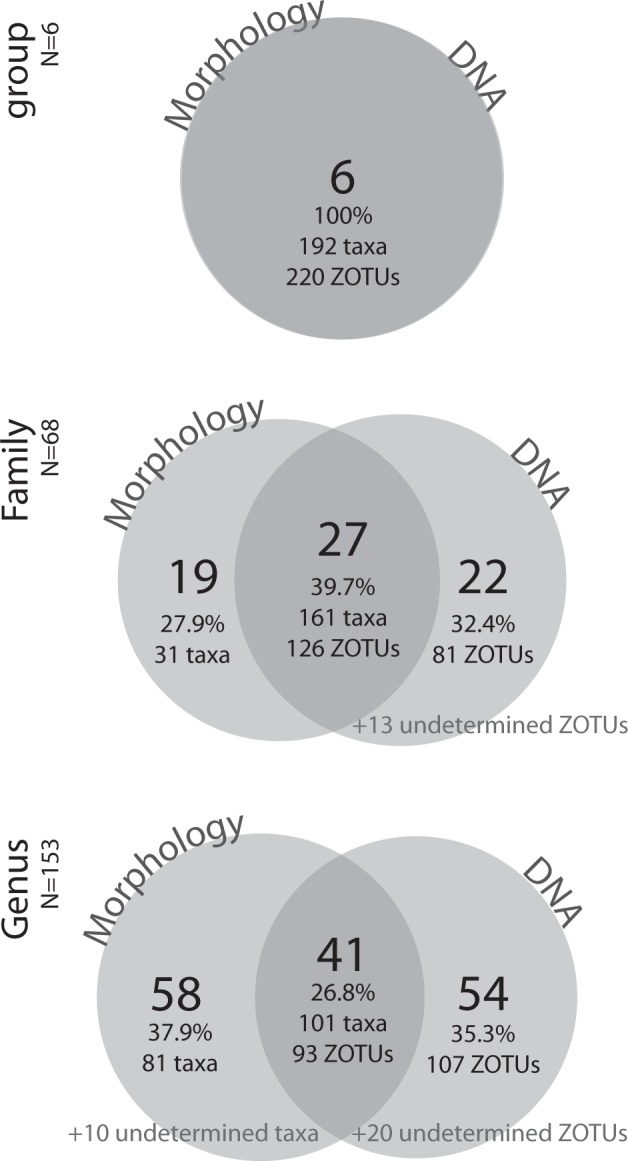
Fig. 3. Venn diagrams at the group, family, and genus level.

Venn diagrams at the group, family, and genus level, to compare how much of the diversity was shared between a traditional morphological approach in identifying taxa and a DNA-based metabarcoding approach to identify ZOTUs, limited to the six main groups (Acoela, Annelida, Gastrotricha, Nemertodermatida, Proseriata, Rhabdocoela) that we analysed both on morphology and on metabarcoding. At the largest taxonomic level, all six groups were found from morphology (192 taxa) and from DNA metabarcoding (220 ZOTUs); at the family level, slightly less than 40% of the total 68 identified families was found by both methods; at the genus level, less than 30% of the total 153 identified genera was found by both methods. Note that a certain number of taxa and ZOTUs could not be assigned to family or genus level, but only to the larger groups. The number of taxa and ZOTUs is also reported.
