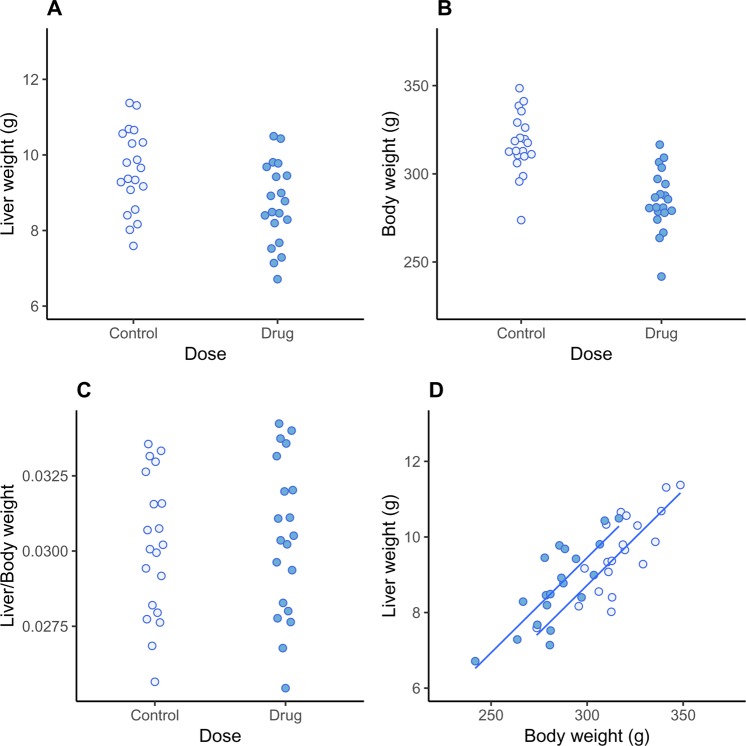
Figure 3.
Simulated data. Liver weight is reduced in the drug-treated group (p = 0.014; A), as is body weight (p < 0.001; B). There are no differences between groups for relative organ weights (p = 0.710; C), suggesting (incorrectly) that changes in liver weight simply reflect changes in overall body weight. Relationship between liver and body weight shows that for a given body weight, animals in the drug-treated group have higher liver weights than control animals (D).

