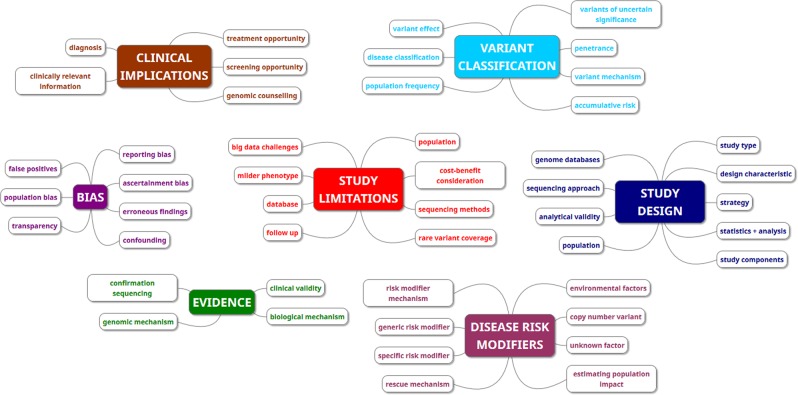
Fig. 2. A schematic depicting the themes and categories generated from the included studies.
The 48 categories generated by the thematic analysis are represented in this schematic as small boxes. The seven themes are represented by large boxes. The colours indicate the overarching theme that the category belongs to.

