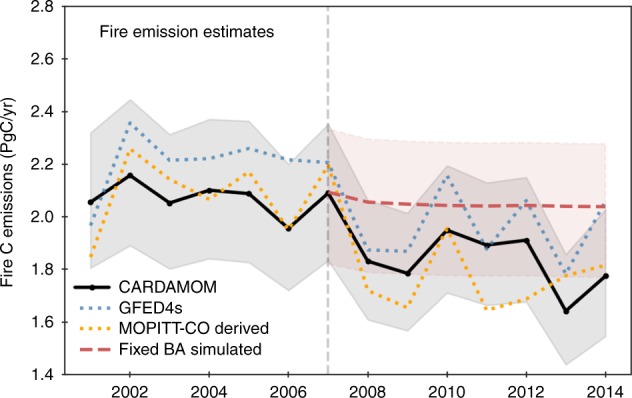
Fig. 2. Global fire carbon emissions estimates for 2001–2014.

The solid black line represents fire carbon emissions estimated by the ensemble median of CARDAMOM, and the shading describes the first and third quartiles using a Monte-Carlo sampling of the parameters. The dotted blue line shows GFED4s bottom-up estimates, and the dotted orange line shows the estimates derived from MOPITT CO inversion and biome-specific emission ratios between CO and total carbon. The dashed red line represents simulated fire emissions using the average burned area during 2001–2007.
