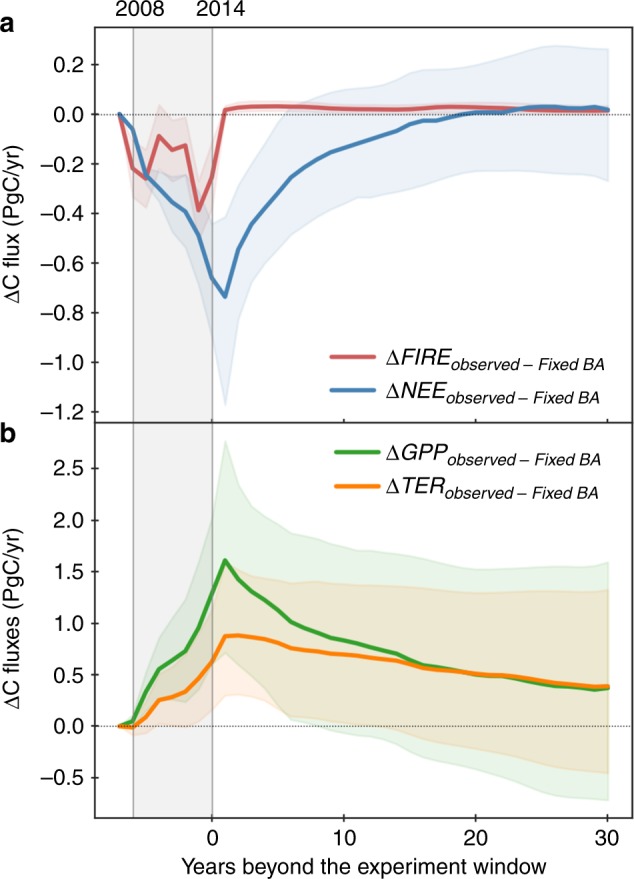
Fig. 3. Impacts of different BA scenarios on the global carbon cycle.

a Relative differences in the simulated global fire carbon emissions (ΔFIRE) and net ecosystem exchange (ΔNEE), and b Relative differences in the simulated global Gross Primary Productivity (ΔGPP) and Terrestrial Ecosystem Respiration (ΔTER) between the Observed BA and the hypothetical BA scenarios—Fixed BA. The lines show the model median and the shadings show the range between 1st and 3nd quartile. Different BA scenarios are only applied within the experiment window (2008–2014) as marked by the grey shade, resultant differences beyond 2014 represent legacy effects of different BA during 2008–2014. Actual meteorological data is used from 2001 to 2014, and the same forcing data is repeatedly used for all scenarios beyond 2014 including the Observed BA.
