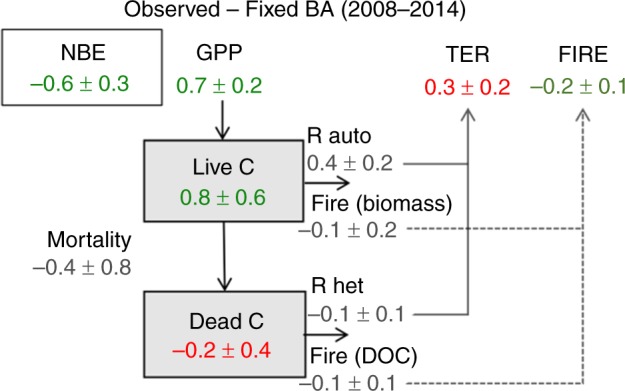
Fig. 4. Differences in the major carbon fluxes and pools between the two scenarios.

The 2008–2014 average differences between the Observed BA and Fixed BA scenarios are shown (Units: PgC per year). Increases in the land sink is denoted in green and decreases in the land sink is denoted in red. NEE = TER − GPP and NBE = NEE + FIRE; negative NBE values represent net fluxes from the atmosphere to the land. Uncertainties are estimated by MCMC simulations.
