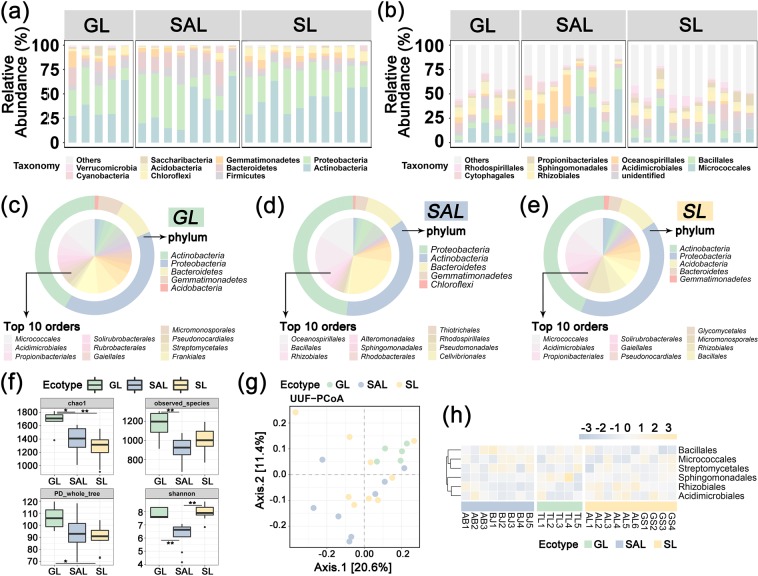
Figure 2.
Classification of the microbial community composition across the three ecotypes of C. deserticola. (a) Histograms of phyla abundances. (b) Histograms of orders abundances. (c) Pie chart of the top 10 microbial orders and their phylum-level species in grassland. (d) Pie chart of the top 10 microbial genera and their phylum-level species in saline-alkali land. (e) Pie chart of the top 10 microbial genera and their phylum-level species in sandy land. (f) Within-sample diversity (α-diversity). *represents P value < 0.05; **represents P value < 0.01. (g) PCoA plot based on the unweighted UniFrac distance matrix of the 16S rRNA gene amplicons. (h) Heatmap of core microbial abundance of three ecotypes of C. deserticola. SAL: Saline-alkali land, GL: Grassland and SL: Sandy land.

