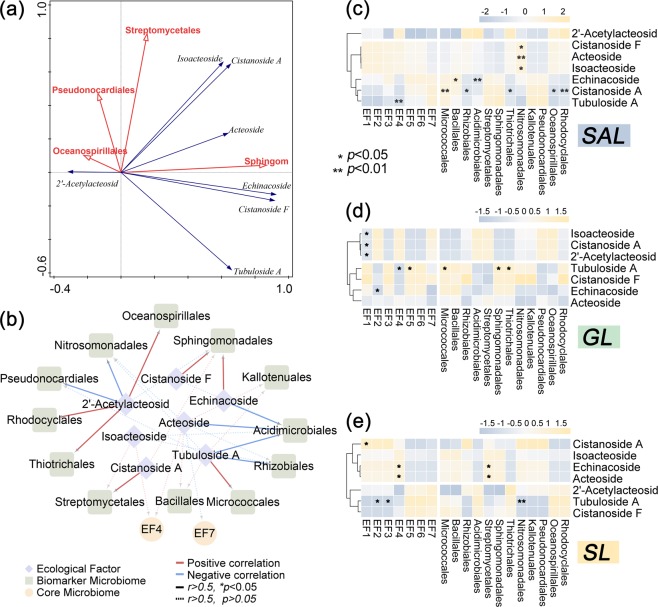
Figure 5.
Correlation analysis based on key microbiome (six biomarkers and six core microbiome), seven active components and ecological factors. (a) RDA plot of overall key microbes, active components and ecological factors by Canoco 5. (b) Network for correlation analysis of overall key microbes, active components and ecological factors. (c) Heatmap for correlation analysis of key microbes, active components and ecological factors in saline-alkali land. (d) Heatmap for correlation analysis of key microbes and ecological factors in grassland. (e) Heatmap for correlation analysis of key microbes and ecological factors in sandy land.*represents p value < 0.05; **represents p value < 0.01. SAL: Saline-alkali land, GL: Grassland and SL: Sandy land.

