Figure 4.
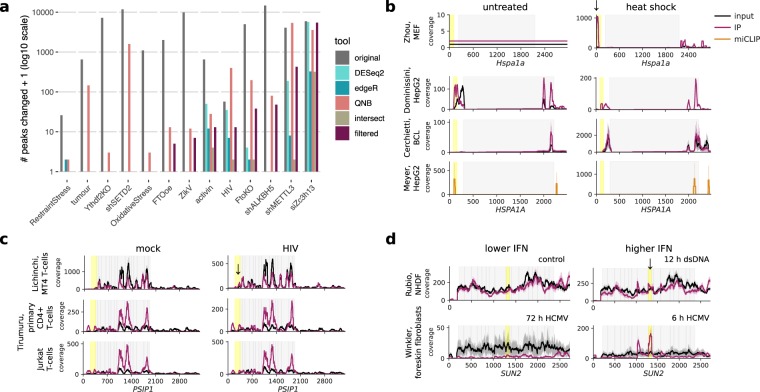
Changes in peaks between conditions. (a) Detected m6A(m) changes in thirteen published data sets that measured m6A(m) peak changes between two conditions (Supplementary Table 4). The number of peaks detected as changed in the original published analyses are compared to the number of peaks with FDR-adjusted p-values < 0.05 in our reanalysis using DESeq2, edgeR, or QNB, and taking the union of results from these three tools with additional filters for log2 fold difference in peak and gene changes of ≥1 and peak read counts ≥10 across all replicates and conditions (“filtered”). (b) Gene coverage plots for Hspa1a in mouse embryonic fibroblasts (MEFs) and HSPA1A in human cells (HepG2 and BCL) before and after heat shock. Input coverage is shown in black and IP coverage in raspberry, with putative m6A peaks changed highlighted in yellow and marked by arrows. miCLIP coverage for an experiment in HepG2 cells is shown in orange. (c) Coverage plots for PSIP1, which was reported to have a change in 5′ UTR m6A with HIV infection by Lichinchi et al. (2016). (d) Coverage plots for SUN2, in which we detected changes in m6A with HCMV infection and dsDNA treatment suggesting a possible increase in methylation under higher interferon conditions (after 12 h of dsDNA treatment compared to untreated controls and after 6 h post-HCMV infection compared to 72 h, when interferon levels have declined). Lines in coverage plots (b-d) show the mean across all replicates for each experiment, while shading shows the standard deviation. Coding sequences are shown in grey.

