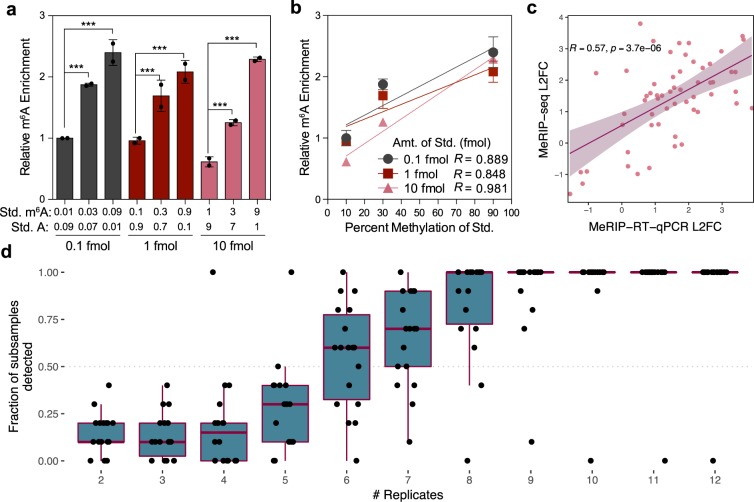
Figure 5.
MeRIP-RT-qPCR validation and replicates necessary for the detection of peak changes. (a) Relative enrichment of the indicated amounts of an in vitro transcribed standard containing unmodified A or m6A, as measured by MeRIP-RT-qPCR. Data are shown for two independent replicates of three technical replicates each as IP enrichment over input relative to pulldown of a positive control spike-in, with the 0.1 fmol (0.01 m6A: 0.09 A) sample normalized to 1. Bars represent mean ± SEM of two independent replicates. ***p ≤ 0.005 by unpaired Student’s t-test. b-d) Linear regression of relative m6A enrichment from (a). Points and error bars mark mean ± SEM of two independent replicates. (c) Change in MeRIP-RT-qPCR vs. MeRIP-seq enrichment for peaks detected as significantly differentially expressed with infection of Huh7 cells by dengue virus, Zika virus, and hepatitis C virus. (d) Number of replicates of infected vs. uninfected cells needed to detect the peaks in (c). Replicates were randomly subsampled 10 times to calculate the fraction of subsamples in which peaks were called as significant by the GLMs or QNB. Boxes span the 1st to 3rd quartiles, with medians indicated. Whiskers show the minimum and maximum points within ±1.5x the interquartile distance from the boxes. Results for each subsample of replicates are shown as jittered points.

