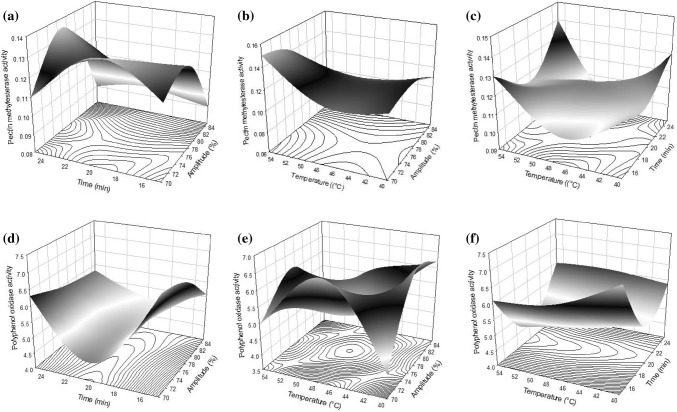
Fig. 3.
Response surface plots of pectin methylesterase activity of fruit smoothie thermosonicated a amplitude (X1) and time (X2), b amplitude (X1) and temperature (X3), and c time (X2) and temperature (X3). Response surface plots of d amplitude (X1) and time (X2), e amplitude (X1) and temperature (X3), f time (X2) and temperature (X3) on polyphenol oxidase activity of fruit smoothie thermosonicated

