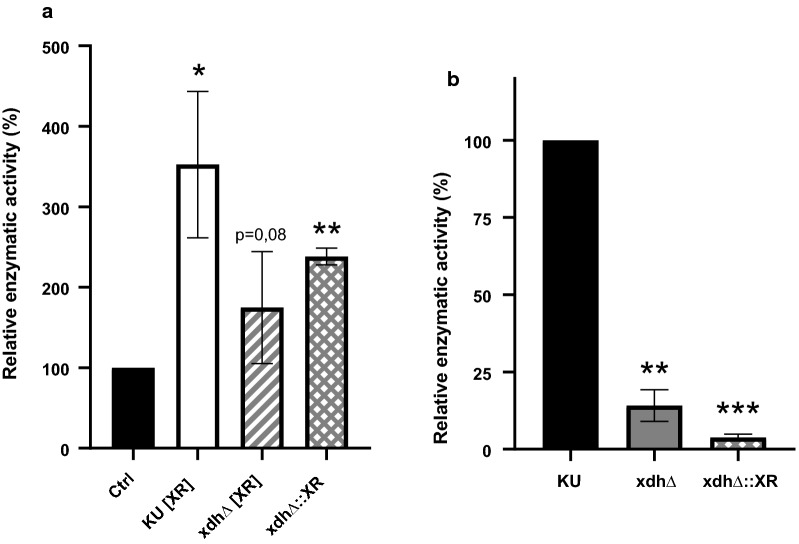
Fig. 3.
Enzymatic activity analysis of M. guilliermondii cell lysates. Measurement of co-factor conversion rates is displayed as a relative enzymatic XR-activity of lysates of KU [EV] (Ctrl), KU [XR], xdhΔ [XR] and xdh∆::XR; b relative enzymatic XDH-activity of lysates of KU, xdhΔ and xdh∆::XR; Displayed are mean values ± SD of at least 3 replicate experiments, each performed in triplicates. The control and parental strains were set to 100%. Asterisks indicate p-values (* = p < 0.05; ** = p < 0.005 and *** = p<0.001)

