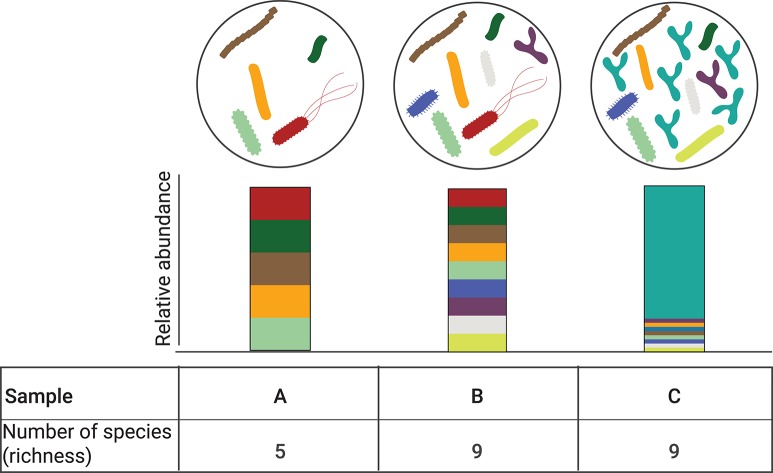
Figure 2.
Alpha diversity is independent of relative abundance. Three different bacterial communities are depicted (A–C). Corresponding relative abundance of the individual species in the bacterial comminutes is represented by the stacked bar graphs. Bacterial communities B and C have the same number of observed species (n = 9) but their relative abundance is different, with community C being dominated by one species. While the alpha diversity can be computed with different metrics, when accounting for community richness, communities B and C species have the same alpha diversity.

