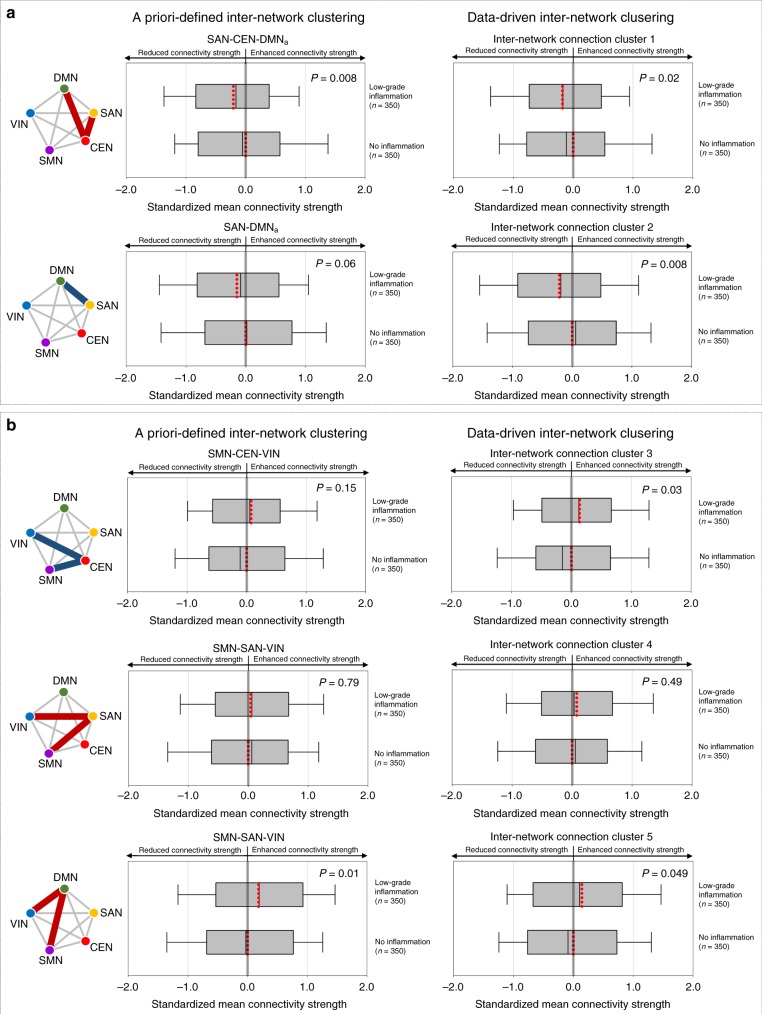
Fig. 3. Results from data set 1: altered inter-network connectivity strength in relation to low-grade inflammation.
a Box-and-whisker plots show the distribution of standardized mean connectivity strength within the higher-order cognitive network system, including the SAN, CEN, and DMNa between the low-grade inflammatory (n = 350) and noninflammatory groups (n = 350). b Box-and-whisker plots show the distribution of standardized mean connectivity strength between the higher-order cognitive network system and the primary sensory network system between the low-grade inflammatory (n = 350) and noninflammatory groups (n = 350). Box-and-whisker plots represent the mean values (red dotted lines inside boxes), median values (black lines inside the boxes), the inter-quartile range (bottom and top ends of the boxes), and the 10th and 90th percentiles of the data (whiskers). Red and blue lines in the schematic diagram for inter-network connection clusters indicate the positive and negative coupling of networks, respectively. Group differences were calculated using the generalized linear models after adjusting for age and sex. P values (for two-sided testing) in the graphs are permutation-adjusted P values (10,000 permutations). Source data are provided as a Source Data file. SAN salience network, DMN default mode network, DMNa default mode network, anterior, CEN central executive network, SMN sensorimotor network, VIN visual network.

