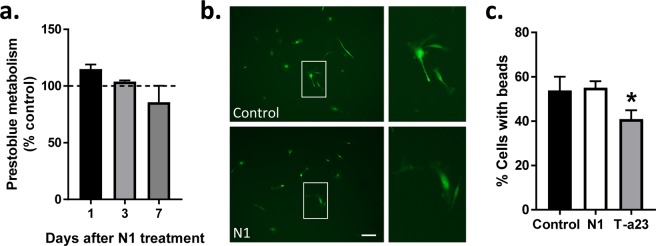
Figure 2.
N1 does not influence MG metabolism, morphology or phagocytic function when grown as a monoculture. (a) Prestoblue metabolism of MG cultures following N1 exposure expressed relative to PBS controls (dotted line). n = 4. (b) Morphology of live MG 7 days following N1 addition. Scale bar = 20 µm. (c) Bead phagocytosis by MG one hour after exposure to N1 or tyrphostin-A23 (T-a23) internalization inhibitor. n = 3. Graphs show the mean and s.e.m. of ‘n’ independent repeats. *p < 0.05.

