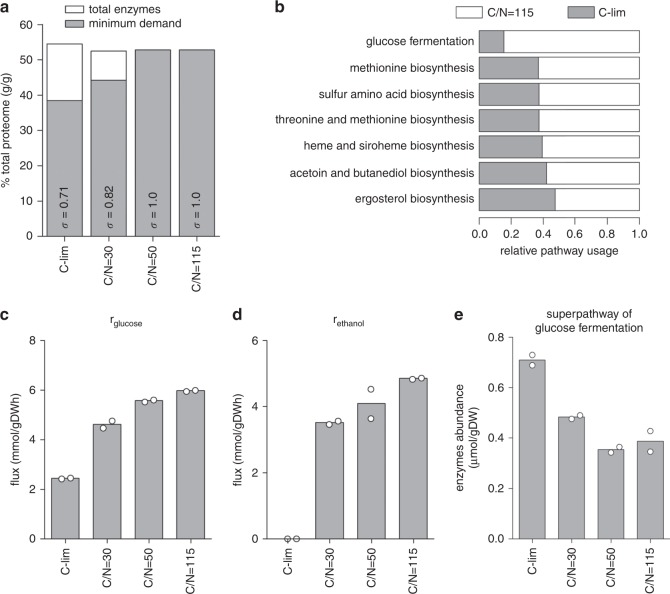
Fig. 3. Metabolic superpathways maintain large reserve capacities in carbon-limited cultures.
a Total enzyme abundance is compared with the minimum enzyme demand calculated in silico by ecYeast8.1 for each condition. The enzyme saturation coefficient σ is shown (see Methods). b Enzyme usage for selected yeast metabolic superpathways. Flux balance analysis (FBA) with random sampling was implemented in ecYeast8.1 to estimate the optimal enzyme requirement for each enzyme (see Methods). Pathway usage was computed as the sum of simulated enzyme requirement divided by the sum of measured enzyme abundance in the pathway. Pathways with relative usage <50% between C-limited and C/N = 115 cultures are shown. c Glucose consumption rate (rglucose) was measured under different culture conditions. Bars are mean of biological duplicates. d Ethanol production rate (rethanol) was measured under different culture conditions. Bars are mean of biological duplicates. e Absolute abundance of enzymes in the superpathway of glucose fermentation was calculated. Bars are mean of biological duplicates.

