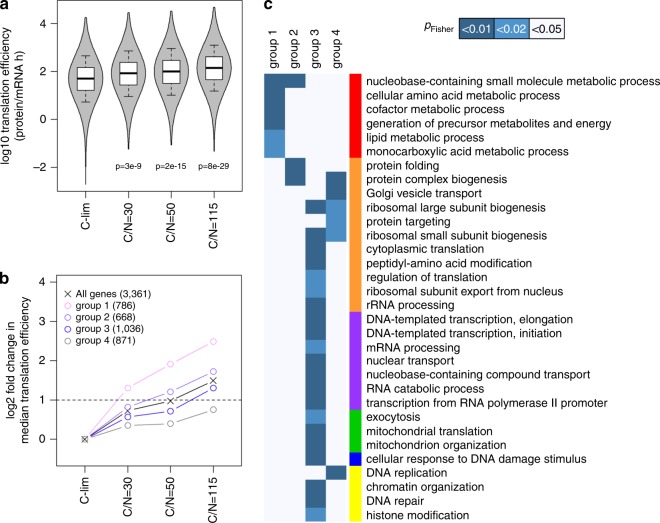
Fig. 4. Reserves of translational capacity are preferentially used to translate metabolic proteins.
a Gene-specific translation efficiency was calculated in all growth conditions. The p-values indicated are from two-sided Student’s t-tests. Center line, median; box limits, upper and lower quartiles; whiskers, 1.5× interquartile range. b Genes were grouped based on the step of nitrogen reduction at which their translation efficiency was increased by log2 > 1. Data points reflect the median translation efficiency of each group, with the # of genes belonging to each group shown in parentheses. Horizontal dashed line indicates twofold increase from C-limited cultures. c Enrichment of GO-slim terms in each gene group as defined in b was analyzed by two-sided Fisher’s exact test. GO-slim terms are color-coded by functional category as in Fig. 1b. GO-slim terms with FDR-adjusted pFisher < 0.05 in at least one gene group are shown.

