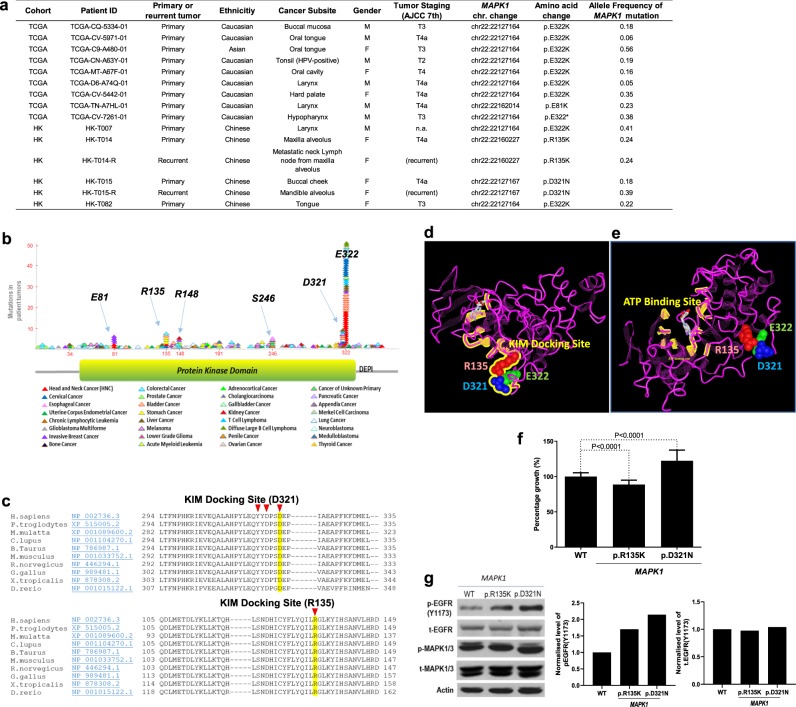
Fig. 1. MAPK1 mutations found in Asian HNSCC are drivers for growth.
a Table showing HNSCC cases with somatic MAPK1 mutations in the US-TCGA-HNSCC Provisional cohort (N = 512 tumors) and the Asian HK-HNSCC cohort (N = 105 tumors). b Mapping of mutation sites of the MAPK1 gene based on the pan-cancer data from TCGA (refs 9,10) and the COSMIC database (ref. 11). Each mutational event is represented by one triangular symbol. Color annotation of various cancer types are shown at the bottom. c Conserved regions of the MAPK1 (ERK2) proteins across species around amino acid positions p.D321 and p.R135 are shown. The amino acid residues of the KIM-docking site are indicated by red arrows. d The X-ray crystallography structure of the human MAPK1 (ERK2) protein (locked with the ATP competitive inhibitor 5-Iodotubercidin and the allosteric inhibitor peptide-type ERK2 inhibitor; PDB ID: 5AX3 (ref. 13); MMDB ID: 136379 (ref. 14). Amino acid residues R135, D321, and E322 are highlighted in red, blue, and green, respectively. Residue R135 is 9.0 Å away from E322 and 11.3 Å away from D321. The peptide sequence of the KIM domain is highlighted and labeled in yellow. e The same X-ray crystallography structure of MAPK1 protein showing the peptide sequence of the ATP-binding domain highlighted in yellow, and the ATP molecule shown in gray color. f Driver activity assay, by MTT assay, of FaDu cells that ectopically expressed MAPK1-WT, MAPK1p.D321N, and MAPK1p.R135K mutants. Cells were seeded on a 48-well plate at a density of 1.2 × 10⁴ cell/well with DMEM and 5% FBS. MTT assay were conducted at 96 h after seeding. A cumulative graph of three independent repeats is shown (total N ≥ 14 wells). Driver activity was normalized against MAPK1-WT. The MAPK1p.D321N is a driver for FaDu cell growth (P < 0.0001; 88.65% ± 1.262 SEM), while the MAPK1p.R135K moderately suppresses cell growth (P < 0.0001; 122.3% ± 4.060 SEM). g Western blotting showing the level of p-EGFR(Y1173), t-EGFR, p-MAPK, and t-MAPK in FaDu cells expressing MAPK1-WT, MAPK1p.R135K, and MAPK1p.D321N mutants, respectively. The p-EGFR and total EGFR levels were normalized to actin, and shown as bar graphs. Three independent repeats were performed and all repeats showed similar trends.

