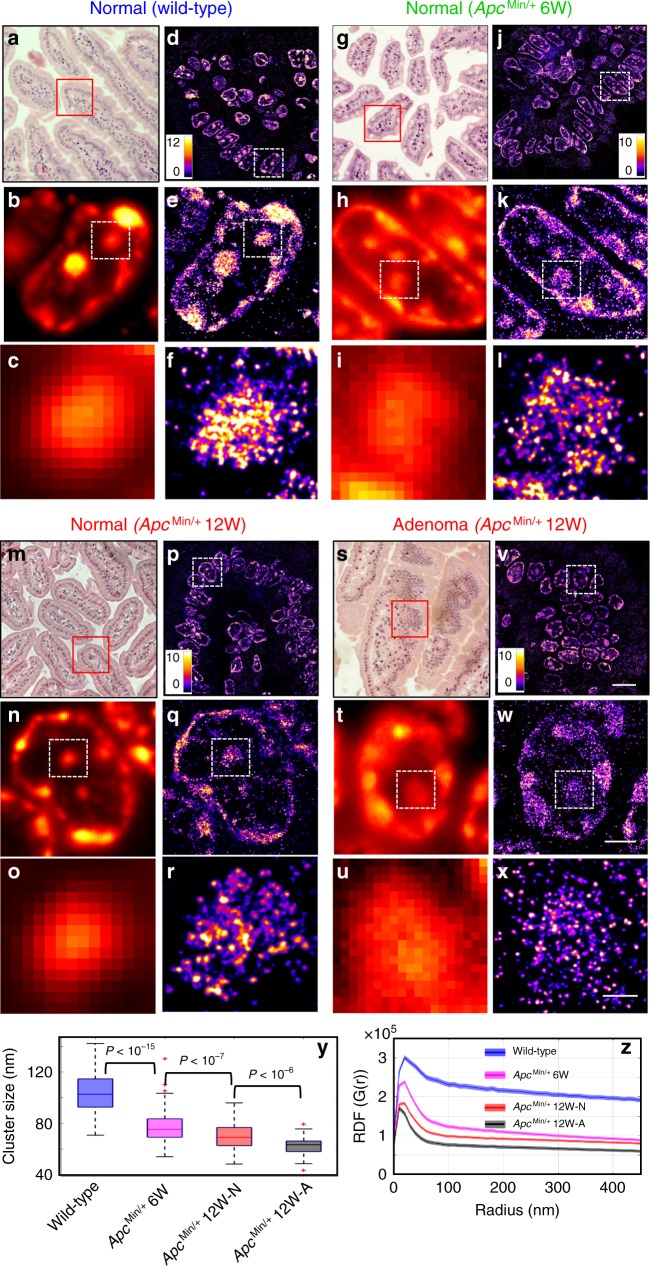
Fig. 1. Super-resolution imaging of heterochromatin structure in ApcMin/+ mouse model.
a, g, m, s H&E-stained pathology images and d, j, p, v STORM-based super-resolution images of H3K9me3-dependent heterochromatin from normal tissue from wild-type, histologically normal-appearing tissue from 6-week and 12-week ApcMin/+, and tumor (adenoma) from 12-week ApcMin/+ mice. Scale bar: 10 µm. b, h, n, t Conventional wide-field fluorescence images and e, k, q, w corresponding STORM images of heterochromatin from a single nucleus. (c, i, o, u) and (f, l, r, x) are progressively zoomed regions of (b, h, n, t) and (e, k, q, w). Scale bar in (e, k, q, w): 2 µm; scale bar in (f, l, r, x): 500 nm. y The box-and-whisker plots of the H3K9me3 cluster size, where the central line of the box indicates the median; the bottom/top edges of the box indicate 25th/75th percentiles; the whiskers extend to the most extreme data points without outliers from four groups. They include wild-type (n = 289 cells), normal-appearing tissue from 6-week (n = 259 cells) and 12-week ApcMin/+ (n = 99 cells) and tumor (adenoma) from 12-week ApcMin/+ mice (n = 55 cells). Cell nuclei from three mice for each category were analyzed. For each mouse, approximately five randomly selected areas of normal-appearing cells located in the villi regions were selected in wild-type and ApcMin/+ mice. In 12-week ApcMin/+ mice with tumors, we also analyzed those regions with adenoma and imaged 3−4 randomly selected tumor regions. z Average radial distribution function (RDF) for all nuclei in each group. The solid curve shows the average RDF from all measured nuclei and the shaded area shows the standard error. This definition was used throughout the entire manuscript. The P value for wild-type vs. 6-week ApcMin/+, for normal-appearing cells in 6-week ApcMin/+ vs. 12-week ApcMin/+, and for normal vs. tumor cells (adenoma) from 12-week ApcMin/+ mice are P < 10−20, P < 10−9 and P < 10−3, respectively. All P values were determined using Mann−Whitney test.

