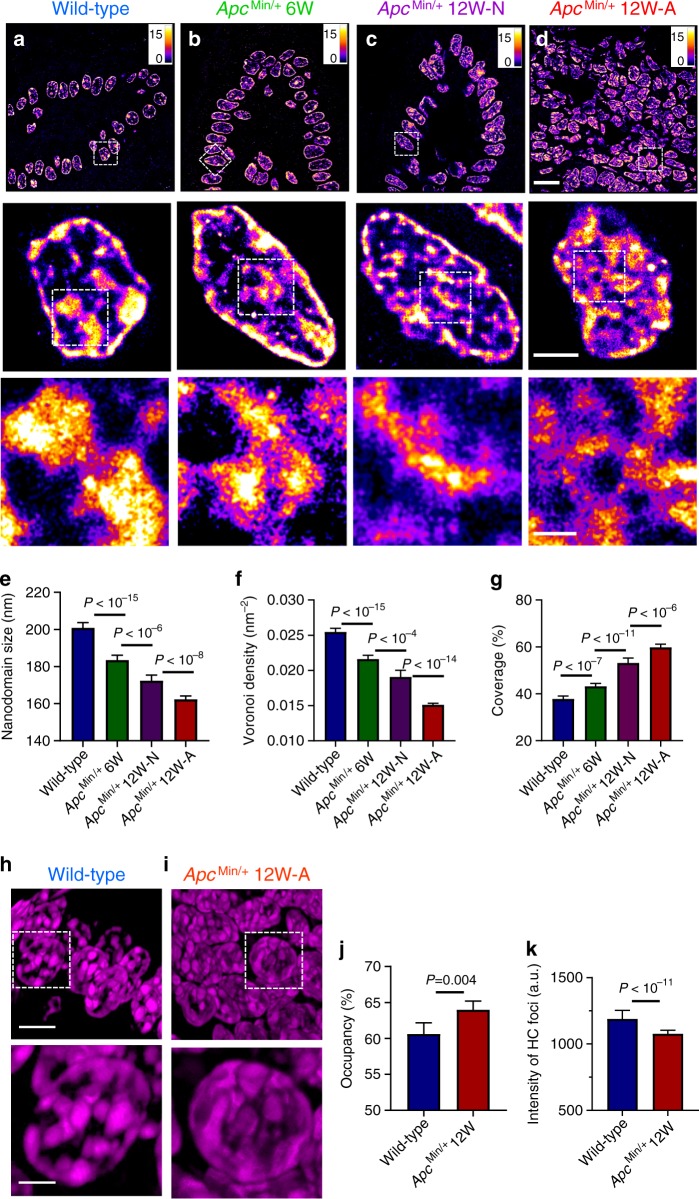
Fig. 2. Super-resolution imaging of DNA in ApcMin/+ mouse model.
a–d STORM images of DNA folding from normal cells from wild-type, histologically normal-appearing cells from 6-week and 12-week ApcMin/+, and tumor cells from 12-week ApcMin/+ mice. Scale bars: 10 µm, 2 µm and 500 nm in the original and magnified images, respectively. e–g The statistical analysis of DNA nanodomain size (e), the local density of DNA quantified by Voronoi polygon density (f) and percentage of occupied DNA domains for each nucleus (g) in normal cells from wild-type mice (n = 72 cells), from 6-week (n = 104 cells) and 12-week ApcMin/+ mice (n = 81 cells) and tumor cells from 12-week ApcMin/+ mice (224 cells). Error bars, mean ± 95% CI. Cell nuclei from three mice for each category were used in the above analysis, as described in the figure caption of Fig. 1. h, i 3D-SIM images of DAPI-stained DNA folding in normal cells from wild-type mice and tumor cells from 12-week ApcMin/+ mice. Scale bars: 5 and 2 µm in the original and magnified images, respectively. j The occupancy of DNA defined by the total volume of DNA over the entire 3D volume of each nucleus, calculated from the 3D-SIM images. k The average fluorescence intensity from each of the condensed region of heterochromatin (HC) foci in 3D-SIM images. Cells from wild-type mice (n = 33 cells) and tumor cells from 12-week ApcMin/+ mice (n = 61 cells) were used in the 3D-SIM image analysis. Error bars: mean ± 95% confidence interval (CI). All P values were determined using Mann−Whitney test.

